22 Day 20: Rural
22.1 Technologies/Techniques
- Integrating external CSV/Excel data with spatial dat
- Working with
{albersusa}and{tigris} - Creating a different kind of map with
{geofacet} - Using
{sf}/geom_sf()
22.2 Data Source: USDA Agricultural Census
The United States Department of Agriculture (USDA) performs an annual agriculture census60 and makes the data available for use by anyone who can decipher their yearly-changing code book.
library(sf)
library(readxl)
library(tigris)
library(geofacet)
library(albersusa)
library(hrbrthemes)
library(tidyverse)
We’ll grab data from 2012 and 2017 and take a look at them:
if (!file.exists(here::here("data/Ag_Census_Map_data_07172015.xlsx"))) {
  download.file(
    url = "https://www.agcensus.usda.gov/Publications/2012/Online_Resources/Ag_Census_Web_Maps/Data_download/Ag_Census_Map_data_07172015.xlsx",
    destfile = here::here("data/Ag_Census_Map_data_07172015.xlsx")
  )
}

if (!file.exists(here::here("data/NASSAgcensusDownload2017.xlsx"))) {
  download.file(
    url = "https://www.nass.usda.gov/Publications/AgCensus/2017/Online_Resources/Ag_Census_Web_Maps/Data_download/NASSAgcensusDownload2017.xlsx",
    destfile = here::here("data/NASSAgcensusDownload2017.xlsx")
  )
}

farms_2012 <- read_excel(here::here("data/Ag_Census_Map_data_07172015.xlsx"), sheet = "Farms", col_names = TRUE)
farms_2017 <- read_excel(here::here("data/NASSAgcensusDownload2017.xlsx"), sheet = "Farms", col_names = TRUE)

glimpse(farms_2012)
## Observations: 3,080
## Variables: 110
## $ FIPS                  <dbl> 0, 1001, 1003, 1005, 1007, 1009, 1011, 1013, 10…
## $ FIPSTEXT              <chr> "00000", "01001", "01003", "01005", "01007", "0…
## $ y12_M003_valueText    <chr> "434", "287", "194", "358", "298", "118", "603"…
## $ y12_M003_classRange   <chr> NA, "180 - 499", "180 - 499", "180 - 499", "180…
## $ y12_M003_valueNumeric <dbl> 434, 287, 194, 358, 298, 118, 603, 217, 137, 32…
## $ y12_M079_valueText    <chr> "40.4", "29.3", "18.9", "36.1", "14.1", "35.4",…
## $ y12_M079_classRange   <chr> NA, "10 - 29", "10 - 29", "30 - 49", "10 - 29",…
## $ y12_M079_valueNumeric <dbl> 40.4, 29.3, 18.9, 36.1, 14.1, 35.4, 41.3, 17.8,…
## $ y12_M082_valueText    <chr> "6.10", "1.39", "3.99", "1.13", "0.10", "0.35",…
## $ y12_M082_classRange   <chr> NA, "1 - 4", "1 - 4", "1 - 4", "Less than 1", "…
## $ y12_M082_valueNumeric <dbl> 6.10, 1.39, 3.99, 1.13, 0.10, 0.35, 0.85, 0.02,…
## $ y12_M085_valueText    <chr> "17.24", "10.85", "9.92", "7.29", "3.16", "9.00…
## $ y12_M085_classRange   <chr> NA, "5 - 14", "5 - 14", "5 - 14", "Less than 5"…
## $ y12_M085_valueNumeric <dbl> 17.24, 10.85, 9.92, 7.29, 3.16, 9.00, 6.55, 4.2…
## $ y12_M086_valueText    <chr> "42.61", "37.03", "52.47", "20.22", "22.40", "2…
## $ y12_M086_classRange   <chr> NA, "20 - 39", "40 - 59", "20 - 39", "20 - 39",…
## $ y12_M086_valueNumeric <dbl> 42.61, 37.03, 52.47, 20.22, 22.40, 25.41, 15.87…
## $ y12_M089_valueText    <chr> "34.44", "26.61", "47.61", "11.22", "13.99", "1…
## $ y12_M089_classRange   <chr> NA, "20 - 39", "40 - 59", "10 - 19", "10 - 19",…
## $ y12_M089_valueNumeric <dbl> 34.44, 26.61, 47.61, 11.22, 13.99, 18.88, 8.04,…
## $ y12_M090_valueText    <chr> "16.54", "5.14", "8.37", "10.04", "0.70", "(D)"…
## $ y12_M090_classRange   <chr> NA, "5 - 19", "5 - 19", "5 - 19", "Less than 5"…
## $ y12_M090_valueNumeric <dbl> 16.54, 5.14, 8.37, 10.04, 0.70, NA, NA, 0.13, 4…
## $ y12_M092_valueText    <chr> "49.87", "29.22", "13.81", "23.62", "22.88", "5…
## $ y12_M092_classRange   <chr> NA, "15 - 29", "Less than 15", "15 - 29", "15 -…
## $ y12_M092_valueNumeric <dbl> 49.87, 29.22, 13.81, 23.62, 22.88, 51.62, 26.11…
## $ y12_M096_valueText    <chr> "26.84", "16.86", "34.43", "7.84", "(D)", "3.82…
## $ y12_M096_classRange   <chr> NA, "5 - 19", "20 - 34", "5 - 19", "Less than 5…
## $ y12_M096_valueNumeric <dbl> 26.84, 16.86, 34.43, 7.84, NA, 3.82, 4.05, 6.83…
## $ y12_M103_valueText    <chr> "60.67", "53.73", "81.78", "38.26", "21.48", "2…
## $ y12_M103_classRange   <chr> NA, "50 - 64", "75 or more", "35 - 49", "20 - 3…
## $ y12_M103_valueNumeric <dbl> 60.67, 53.73, 81.78, 38.26, 21.48, 27.02, 30.60…
## $ y12_M117_valueText    <chr> "86.71", "91.77", "85.74", "88.44", "87.30", "9…
## $ y12_M117_classRange   <chr> NA, "90 - 94", "85 - 89", "85 - 89", "85 - 89",…
## $ y12_M117_valueNumeric <dbl> 86.71, 91.77, 85.74, 88.44, 87.30, 92.51, 86.45…
## $ y12_M118_valueText    <chr> "6.54", "4.88", "5.86", "6.65", "7.41", "4.59",…
## $ y12_M118_classRange   <chr> NA, "Less than 5", "5 - 9", "5 - 9", "5 - 9", "…
## $ y12_M118_valueNumeric <dbl> 6.54, 4.88, 5.86, 6.65, 7.41, 4.59, 6.23, 3.69,…
## $ y12_M119_valueText    <chr> "5.06", "2.83", "5.97", "3.50", "5.29", "2.66",…
## $ y12_M119_classRange   <chr> NA, "2 - 4", "5 - 9", "2 - 4", "5 - 9", "2 - 4"…
## $ y12_M119_valueNumeric <dbl> 5.06, 2.83, 5.97, 3.50, 5.29, 2.66, 6.96, 1.23,…
## $ y12_M247_valueText    <chr> "69.60", "63.24", "68.45", "58.32", "61.90", "6…
## $ y12_M247_classRange   <chr> NA, "60 - 69", "60 - 69", "50 - 59", "60 - 69",…
## $ y12_M247_valueNumeric <dbl> 69.60, 63.24, 68.45, 58.32, 61.90, 65.83, 60.07…
## $ y12_M249_valueText    <chr> "2109303", "389", "989", "571", "189", "1241", …
## $ y12_M249_classRange   <chr> NA, "250 - 499", "750 - 999", "500 - 749", "Les…
## $ y12_M249_valueNumeric <dbl> 2109303, 389, 989, 571, 189, 1241, 273, 407, 59…
## $ y12_M250_valueText    <chr> "-2.87", "-1.22", "-2.77", "-1.66", "-2.12", "-…
## $ y12_M250_classRange   <chr> NA, "Sparse Data", "Significant Decrease", "Sli…
## $ y12_M250_valueNumeric <dbl> -2.87, -1.22, -2.77, -1.66, -2.12, -2.54, -0.27…
## $ y12_M251_valueText    <chr> "-0.68", "0.34", "-0.12", "-8.23", "-5.06", "-1…
## $ y12_M251_classRange   <chr> NA, "Sparse Data", "Negligible Change", "Signif…
## $ y12_M251_valueNumeric <dbl> -0.68, 0.34, -0.12, -8.23, -5.06, -1.83, -6.86,…
## $ y12_M252_valueText    <chr> "-2.39", "0.00", "-3.22", "-7.51", "-5.68", "-4…
## $ y12_M252_classRange   <chr> NA, "Sparse Data", "Significant Decrease", "Sig…
## $ y12_M252_valueNumeric <dbl> -2.39, 0.00, -3.22, -7.51, -5.68, -4.50, -1.99,…
## $ y12_M253_valueText    <chr> "-3.87", "-3.27", "-2.93", "-0.15", "-3.39", "-…
## $ y12_M253_classRange   <chr> NA, "Significant Decrease", "Significant Decrea…
## $ y12_M253_valueNumeric <dbl> -3.87, -3.27, -2.93, -0.15, -3.39, -1.40, 0.73,…
## $ y12_M254_valueText    <chr> "-2.70", "-0.83", "0.00", "-0.23", "1.98", "0.4…
## $ y12_M254_classRange   <chr> NA, "Sparse Data", "Sparse Data", "Sparse Data"…
## $ y12_M254_valueNumeric <dbl> -2.70, -0.83, 0.00, -0.23, 1.98, 0.46, 0.89, -1…
## $ y12_M255_valueText    <chr> "-2.82", "0.75", "-1.92", "0.19", "1.13", "-0.1…
## $ y12_M255_classRange   <chr> NA, "Sparse Data", "Slight Decrease", "Sparse D…
## $ y12_M255_valueNumeric <dbl> -2.82, 0.75, -1.92, 0.19, 1.13, -0.17, -0.09, -…
## $ y12_M256_valueText    <chr> "-1.15", "0.38", "-0.94", "-0.68", "0.00", "0.7…
## $ y12_M256_classRange   <chr> NA, "Sparse Data", "Negligible Change", "Sparse…
## $ y12_M256_valueNumeric <dbl> -1.15, 0.38, -0.94, -0.68, 0.00, 0.71, -1.20, 1…
## $ y12_M257_valueText    <chr> "1.51", "0.42", "1.18", "-0.25", "2.83", "0.94"…
## $ y12_M257_classRange   <chr> NA, "Sparse Data", "Sparse Data", "Sparse Data"…
## $ y12_M257_valueNumeric <dbl> 1.51, 0.42, 1.18, -0.25, 2.83, 0.94, 0.67, 1.26…
## $ y12_M261_valueText    <chr> "-0.96", "0.09", "0.13", "0.25", "3.16", "-0.34…
## $ y12_M261_classRange   <chr> NA, "Sparse Data", "Sparse Data", "Sparse Data"…
## $ y12_M261_valueNumeric <dbl> -0.96, 0.09, 0.13, 0.25, 3.16, -0.34, 1.82, -0.…
## $ y12_M262_valueText    <chr> "-1.07", "0.73", "-0.92", "-0.60", "-5.62", "-0…
## $ y12_M262_classRange   <chr> NA, "Sparse Data", "Negligible Change", "Sparse…
## $ y12_M262_valueNumeric <dbl> -1.07, 0.73, -0.92, -0.60, -5.62, -0.29, NA, -8…
## $ y12_M263_valueText    <chr> "-9.07", "-0.19", "-0.16", "-2.83", "2.37", "-1…
## $ y12_M263_classRange   <chr> NA, "Sparse Data", "Sparse Data", "Significant …
## $ y12_M263_valueNumeric <dbl> -9.07, -0.19, -0.16, -2.83, 2.37, -1.93, -1.95,…
## $ y12_M264_valueText    <chr> "4.39", "2.37", "0.63", "0.03", "2.01", "-0.21"…
## $ y12_M264_classRange   <chr> NA, "Sparse Data", "Sparse Data", "Sparse Data"…
## $ y12_M264_valueNumeric <dbl> 4.39, 2.37, 0.63, 0.03, 2.01, -0.21, 1.43, -0.5…
## $ y12_M265_valueText    <chr> "0.82", "0.09", "0.04", "0.00", "0.00", "(D)", …
## $ y12_M265_classRange   <chr> NA, "Less than 1", "Less than 1", "Less than 1"…
## $ y12_M265_valueNumeric <dbl> 0.82, 0.09, 0.04, 0.00, 0.00, NA, NA, 0.00, 0.4…
## $ y12_M266_valueText    <chr> "3.01", "2.96", "4.09", "7.68", "0.86", "0.90",…
## $ y12_M266_classRange   <chr> NA, "1 - 2", "3 - 5", "6 - 8", "Less than 1", "…
## $ y12_M266_valueNumeric <dbl> 3.01, 2.96, 4.09, 7.68, 0.86, 0.90, 7.24, 4.18,…
## $ y12_M269_valueText    <chr> "63.59", "63.31", "89.67", "54.95", "41.97", "8…
## $ y12_M269_classRange   <chr> NA, "60 - 69", "80 or more", "50 - 59", "40 - 4…
## $ y12_M269_valueNumeric <dbl> 63.59, 63.31, 89.67, 54.95, 41.97, 84.34, 44.06…
## $ y12_M270_valueText    <chr> "5.66", "5.89", "7.78", "17.98", "(D)", "53.80"…
## $ y12_M270_classRange   <chr> NA, "5 - 14", "5 - 14", "15 - 29", "Less than 5…
## $ y12_M270_valueNumeric <dbl> 5.66, 5.89, 7.78, 17.98, NA, 53.80, 14.08, 19.6…
## $ y12_M271_valueText    <chr> "25.85", "33.32", "75.98", "23.11", "(D)", "25.…
## $ y12_M271_classRange   <chr> NA, "30 - 39", "60 or more", "20 - 29", "10 - 1…
## $ y12_M271_valueNumeric <dbl> 25.85, 33.32, 75.98, 23.11, NA, 25.08, 21.51, 1…
## $ y12_M272_valueText    <chr> "3.71", "8.39", "16.01", "7.07", "(D)", "4.58",…
## $ y12_M272_classRange   <chr> NA, "5 - 9", "10 - 19", "5 - 9", "5 - 9", "Less…
## $ y12_M272_valueNumeric <dbl> 3.71, 8.39, 16.01, 7.07, NA, 4.58, 10.26, 0.43,…
## $ y12_M273_valueText    <chr> "73.27", "55.87", "82.35", "41.99", "42.66", "8…
## $ y12_M273_classRange   <chr> NA, "50 - 64", "75 - 89", "30 - 49", "30 - 49",…
## $ y12_M273_valueNumeric <dbl> 73.27, 55.87, 82.35, 41.99, 42.66, 85.16, 36.23…
## $ y12_M274_valueText    <chr> "3.37", "15.72", "11.17", "5.71", "(D)", "4.23"…
## $ y12_M274_classRange   <chr> NA, "15 - 24", "10 - 14", "5 - 9", "5 - 9", "1 …
## $ y12_M274_valueNumeric <dbl> 3.37, 15.72, 11.17, 5.71, NA, 4.23, 10.54, 0.39…
## $ y12_M275_valueText    <chr> "8.98", "3.46", "56.82", "1.67", "(D)", "4.08",…
## $ y12_M275_classRange   <chr> NA, "Less than 5", "40 or more", "Less than 5",…
## $ y12_M275_valueNumeric <dbl> 8.98, 3.46, 56.82, 1.67, NA, 4.08, 12.35, 5.02,…

glimpse(farms_2017)
## Observations: 3,080
## Variables: 110
## $ FIPS                  <dbl> 0, 1001, 1003, 1005, 1007, 1009, 1011, 1013, 10…
## $ FIPSTEXT              <chr> "00000", "01001", "01003", "01005", "01007", "0…
## $ y17_M001_valueText    <chr> "2042220", "371", "842", "498", "205", "1146", …
## $ y17_M001_classRange   <chr> NA, "250 - 499", "750 - 999", "250 - 499", "Les…
## $ y17_M001_valueNumeric <dbl> 2042220, 371, 842, 498, 205, 1146, 255, 420, 64…
## $ y17_M002_valueText    <chr> "-0.87", "-0.17", "-0.59", "-0.50", "0.27", "-0…
## $ y17_M002_classRange   <chr> NA, "Sparse Data", "Negligible Change", "Neglig…
## $ y17_M002_valueNumeric <dbl> -0.87, -0.17, -0.59, -0.50, 0.27, -0.28, -0.24,…
## $ y17_M003_valueText    <chr> "441", "305", "208", "307", "273", "129", "452"…
## $ y17_M003_classRange   <chr> NA, "180 - 499", "180 - 499", "180 - 499", "180…
## $ y17_M003_valueNumeric <dbl> 441, 305, 208, 307, 273, 129, 452, 201, 138, 38…
## $ y17_M004_valueText    <chr> "1.30", "0.03", "0.01", "-0.06", "0.44", "0.04"…
## $ y17_M004_classRange   <chr> NA, "Sparse Data", "Sparse Data", "Sparse Data"…
## $ y17_M004_valueNumeric <dbl> 1.30, 0.03, 0.01, -0.06, 0.44, 0.04, 0.19, -0.7…
## $ y17_M005_valueText    <chr> "-0.15", "-0.16", "-0.47", "0.56", "-0.05", "-0…
## $ y17_M005_classRange   <chr> NA, "Sparse Data", "Negligible Change", "Sparse…
## $ y17_M005_valueNumeric <dbl> -0.15, -0.16, -0.47, 0.56, -0.05, -0.22, -0.11,…
## $ y17_M006_valueText    <chr> "-5.10", "-0.13", "-1.05", "-0.69", "-0.25", "-…
## $ y17_M006_classRange   <chr> NA, "Sparse Data", "Slight Decrease", "Negligib…
## $ y17_M006_valueNumeric <dbl> -5.10, -0.13, -1.05, -0.69, -0.25, -0.54, -0.04…
## $ y17_M007_valueText    <chr> "-2.68", "-0.21", "-0.79", "-0.63", "0.54", "0.…
## $ y17_M007_classRange   <chr> NA, "Sparse Data", "Negligible Change", "Neglig…
## $ y17_M007_valueNumeric <dbl> -2.68, -0.21, -0.79, -0.63, 0.54, 0.23, 0.35, -…
## $ y17_M008_valueText    <chr> "-2.16", "0.05", "0.36", "-0.38", "-1.38", "-0.…
## $ y17_M008_classRange   <chr> NA, "Sparse Data", "Sparse Data", "Sparse Data"…
## $ y17_M008_valueNumeric <dbl> -2.16, 0.05, 0.36, -0.38, -1.38, -0.12, -0.73, …
## $ y17_M009_valueText    <chr> "-0.89", "0.00", "0.44", "0.23", "-0.23", "0.42…
## $ y17_M009_classRange   <chr> NA, "Sparse Data", "Sparse Data", "Sparse Data"…
## $ y17_M009_valueNumeric <dbl> -0.89, 0.00, 0.44, 0.23, -0.23, 0.42, 0.07, -1.…
## $ y17_M010_valueText    <chr> "0.88", "-0.27", "-0.46", "-1.02", "1.47", "-0.…
## $ y17_M010_classRange   <chr> NA, "Sparse Data", "Sparse Data", "Sparse Data"…
## $ y17_M010_valueNumeric <dbl> 0.88, -0.27, -0.46, -1.02, 1.47, -0.62, -1.54, …
## $ y17_M058_valueText    <chr> "-0.60", "0.06", "-0.35", "-1.10", "-0.02", "0.…
## $ y17_M058_classRange   <chr> NA, "Sparse Data", "Sparse Data", "Slight Decre…
## $ y17_M058_valueNumeric <dbl> -0.60, 0.06, -0.35, -1.10, -0.02, 0.05, -1.35, …
## $ y17_M059_valueText    <chr> "39.8", "29.8", "17.2", "27.0", "14.0", "35.9",…
## $ y17_M059_classRange   <chr> NA, "10 - 29", "10 - 29", "10 - 29", "10 - 29",…
## $ y17_M059_valueNumeric <dbl> 39.8, 29.8, 17.2, 27.0, 14.0, 35.9, 28.9, 17.0,…
## $ y17_M060_valueText    <chr> "1.20", "-0.16", "-0.05", "0.76", "0.59", "1.00…
## $ y17_M060_classRange   <chr> NA, "Sparse Data", "Sparse Data", "Sparse Data"…
## $ y17_M060_valueNumeric <dbl> 1.20, -0.16, -0.05, 0.76, 0.59, 1.00, -1.83, 2.…
## $ y17_M061_valueText    <chr> "6.44", "1.25", "4.25", "2.36", "0.14", "0.63",…
## $ y17_M061_classRange   <chr> NA, "1 - 4", "1 - 4", "1 - 4", "Less than 1", "…
## $ y17_M061_valueNumeric <dbl> 6.44, 1.25, 4.25, 2.36, 0.14, 0.63, 0.10, 0.65,…
## $ y17_M062_valueText    <chr> "1.11", "-0.34", "0.27", "-0.31", "0.65", "0.48…
## $ y17_M062_classRange   <chr> NA, "Sparse Data", "Sparse Data", "Sparse Data"…
## $ y17_M062_valueNumeric <dbl> 1.11, -0.34, 0.27, -0.31, 0.65, 0.48, -0.83, -0…
## $ y17_M063_valueText    <chr> "17.54", "9.70", "10.85", "6.59", "3.97", "10.6…
## $ y17_M063_classRange   <chr> NA, "5 - 14", "5 - 14", "5 - 14", "Less than 5"…
## $ y17_M063_valueNumeric <dbl> 17.54, 9.70, 10.85, 6.59, 3.97, 10.61, 5.01, 3.…
## $ y17_M064_valueText    <chr> "44.04", "32.58", "63.18", "24.42", "28.27", "2…
## $ y17_M064_classRange   <chr> NA, "20 - 39", "60 - 79", "20 - 39", "20 - 39",…
## $ y17_M064_valueNumeric <dbl> 44.04, 32.58, 63.18, 24.42, 28.27, 29.55, 17.32…
## $ y17_M065_valueText    <chr> "0.92", "-0.21", "0.08", "0.27", "0.86", "0.33"…
## $ y17_M065_classRange   <chr> NA, "Sparse Data", "Sparse Data", "Sparse Data"…
## $ y17_M065_valueNumeric <dbl> 0.92, -0.21, 0.08, 0.27, 0.86, 0.33, -0.82, 0.1…
## $ y17_M066_valueText    <chr> "35.55", "24.34", "53.95", "16.52", "19.32", "2…
## $ y17_M066_classRange   <chr> NA, "20 - 39", "40 - 59", "10 - 19", "10 - 19",…
## $ y17_M066_valueNumeric <dbl> 35.55, 24.34, 53.95, 16.52, 19.32, 20.98, 8.61,…
## $ y17_M067_valueText    <chr> "16.86", "4.22", "(D)", "(D)", "0.61", "2.17", …
## $ y17_M067_classRange   <chr> NA, "Less than 5", "5 - 19", "5 - 19", "Less th…
## $ y17_M067_valueNumeric <dbl> 16.86, 4.22, NA, NA, 0.61, 2.17, 1.21, 0.67, NA…
## $ y17_M068_valueText    <chr> "48.94", "25.45", "19.51", "30.00", "29.43", "4…
## $ y17_M068_classRange   <chr> NA, "15 - 29", "15 - 29", "30 - 49", "15 - 29",…
## $ y17_M068_valueNumeric <dbl> 48.94, 25.45, 19.51, 30.00, 29.43, 48.17, 32.47…
## $ y17_M069_valueText    <chr> "0.92", "0.86", "(D)", "(D)", "0.07", "0.36", "…
## $ y17_M069_classRange   <chr> NA, "Less than 1", "Less than 1", "Less than 1"…
## $ y17_M069_valueNumeric <dbl> 0.92, 0.86, NA, NA, 0.07, 0.36, 0.00, 2.32, NA,…
## $ y17_M070_valueText    <chr> "2.55", "1.17", "1.83", "7.43", "0.76", "1.18",…
## $ y17_M070_classRange   <chr> NA, "1 - 2", "1 - 2", "6 - 8", "Less than 1", "…
## $ y17_M070_valueNumeric <dbl> 2.55, 1.17, 1.83, 7.43, 0.76, 1.18, 5.60, 1.69,…
## $ y17_M071_valueText    <chr> "31.59", "14.15", "42.38", "12.72", "8.47", "8.…
## $ y17_M071_classRange   <chr> NA, "5 - 19", "35 - 49", "5 - 19", "5 - 19", "5…
## $ y17_M071_valueNumeric <dbl> 31.59, 14.15, 42.38, 12.72, 8.47, 8.74, 8.63, 9…
## $ y17_M076_valueText    <chr> "64.01", "67.53", "80.79", "78.84", "52.53", "8…
## $ y17_M076_classRange   <chr> NA, "60 - 69", "80 or more", "70 - 79", "50 - 5…
## $ y17_M076_valueNumeric <dbl> 64.01, 67.53, 80.79, 78.84, 52.53, 84.41, 41.69…
## $ y17_M077_valueText    <chr> "60.98", "45.18", "76.69", "48.87", "25.89", "3…
## $ y17_M077_classRange   <chr> NA, "35 - 49", "75 or more", "35 - 49", "20 - 3…
## $ y17_M077_valueNumeric <dbl> 60.98, 45.18, 76.69, 48.87, 25.89, 30.09, 26.04…
## $ y17_M078_valueText    <chr> "6.03", "10.11", "5.48", "28.16", "4.64", "29.6…
## $ y17_M078_classRange   <chr> NA, "5 - 14", "5 - 14", "15 - 29", "Less than 5…
## $ y17_M078_valueNumeric <dbl> 6.03, 10.11, 5.48, 28.16, 4.64, 29.60, 20.77, 1…
## $ y17_M079_valueText    <chr> "28.36", "27.88", "70.25", "27.11", "(D)", "18.…
## $ y17_M079_classRange   <chr> NA, "20 - 29", "60 or more", "20 - 29", "10 - 1…
## $ y17_M079_valueNumeric <dbl> 28.36, 27.88, 70.25, 27.11, NA, 18.45, 19.50, 1…
## $ y17_M080_valueText    <chr> "3.70", "0.18", "15.83", "1.36", "0.00", "4.43"…
## $ y17_M080_classRange   <chr> NA, "Less than 1", "15 - 24", "1 - 4", "Less th…
## $ y17_M080_valueNumeric <dbl> 3.70, 0.18, 15.83, 1.36, 0.00, 4.43, 0.43, 1.86…
## $ y17_M081_valueText    <chr> "73.91", "58.36", "78.42", "63.91", "55.13", "8…
## $ y17_M081_classRange   <chr> NA, "50 - 64", "75 - 89", "50 - 64", "50 - 64",…
## $ y17_M081_valueNumeric <dbl> 73.91, 58.36, 78.42, 63.91, 55.13, 81.70, 46.45…
## $ y17_M082_valueText    <chr> "3.72", "23.90", "10.64", "7.19", "0.00", "3.77…
## $ y17_M082_classRange   <chr> NA, "20 - 29", "10 - 19", "5 - 9", "Less than 5…
## $ y17_M082_valueNumeric <dbl> 3.72, 23.90, 10.64, 7.19, 0.00, 3.77, NA, NA, 1…
## $ y17_M083_valueText    <chr> "11.17", "0.90", "54.45", "(D)", "(D)", "1.18",…
## $ y17_M083_classRange   <chr> NA, "Less than 5", "40 or more", "Less than 5",…
## $ y17_M083_valueNumeric <dbl> 11.17, 0.90, 54.45, NA, NA, 1.18, 2.12, 12.12, …
## $ y17_M091_valueText    <chr> "85.75", "93.26", "85.27", "93.37", "93.17", "9…
## $ y17_M091_classRange   <chr> NA, "90 - 94", "85 - 89", "90 - 94", "90 - 94",…
## $ y17_M091_valueNumeric <dbl> 85.75, 93.26, 85.27, 93.37, 93.17, 94.24, 79.22…
## $ y17_M092_valueText    <chr> "6.37", "4.58", "5.34", "3.21", "1.95", "3.49",…
## $ y17_M092_classRange   <chr> NA, "Less than 5", "5 - 9", "Less than 5", "Les…
## $ y17_M092_valueNumeric <dbl> 6.37, 4.58, 5.34, 3.21, 1.95, 3.49, 13.33, 2.62…
## $ y17_M093_valueText    <chr> "5.72", "1.35", "7.24", "2.81", "4.88", "2.01",…
## $ y17_M093_classRange   <chr> NA, "Less than 2", "5 - 9", "2 - 4", "2 - 4", "…
## $ y17_M093_valueNumeric <dbl> 5.72, 1.35, 7.24, 2.81, 4.88, 2.01, 5.49, 4.76,…
## $ y17_M201_valueText    <chr> "75.41", "76.82", "78.15", "60.64", "73.17", "7…
## $ y17_M201_classRange   <chr> NA, "75 - 84", "75 - 84", "55 - 64", "65 - 74",…
## $ y17_M201_valueNumeric <dbl> 75.41, 76.82, 78.15, 60.64, 73.17, 74.61, 69.02…
After reading through the USDA census site for a bit, I managed to find the columns that pertained to the number of farms per-county for each year, so we’ll setup an ordered factor (based on the categories the USDA uses), extract out the counts for each year and integrate them with county shapefile data from {albersusa}:
# make an ordered factor for thee categories
ffactor <- c("Less than 250", "250 - 499", "500 - 749", "750 - 999", "1,000 or more")

counties_sf() %>%
  mutate(fips = as.character(fips)) %>%
  left_join(
    select(
      farms_2012,
      fips = FIPSTEXT,
      range = y12_M249_classRange,
      ct = y12_M249_valueNumeric
    ),
    by = "fips"
  ) %>%
  mutate(
    year = "2012",
    range = factor(range, ffactor)
  ) -> y2012

counties_sf() %>%
  mutate(fips = as.character(fips)) %>%
  left_join(
    select(
      farms_2017,
      fips = FIPSTEXT,
      range = y17_M001_classRange,
      ct = y17_M001_valueNumeric
    ),
    by = "fips"
  ) %>%
  mutate(
    year = "2017",
    range = factor(range, ffactor)
  ) -> y2017

glimpse(y2012)
## Observations: 3,143
## Variables: 12
## $ fips        <chr> "01001", "01009", "01017", "01021", "01033", "01045", "01…
## $ state_fips  <fct> 01, 01, 01, 01, 01, 01, 01, 01, 01, 01, 01, 01, 01, 05, 0…
## $ county_fips <fct> 001, 009, 017, 021, 033, 045, 051, 065, 079, 083, 099, 10…
## $ name        <fct> Autauga, Blount, Chambers, Chilton, Colbert, Dale, Elmore…
## $ lsad        <fct> County, County, County, County, County, County, County, C…
## $ census_area <dbl> 594.436, 644.776, 596.531, 692.854, 592.619, 561.150, 618…
## $ state       <fct> Alabama, Alabama, Alabama, Alabama, Alabama, Alabama, Ala…
## $ iso_3166_2  <fct> AL, AL, AL, AL, AL, AL, AL, AL, AL, AL, AL, AL, AL, AR, A…
## $ range       <fct> "250 - 499", "1,000 or more", "250 - 499", "500 - 749", "…
## $ ct          <dbl> 389, 1241, 301, 543, 687, 487, 552, 456, 1551, 1230, 480,…
## $ geometry    <MULTIPOLYGON [°]> MULTIPOLYGON (((-86.49677 3..., MULTIPOLYGON…
## $ year        <chr> "2012", "2012", "2012", "2012", "2012", "2012", "2012", "…

glimpse(y2017)
## Observations: 3,143
## Variables: 12
## $ fips        <chr> "01001", "01009", "01017", "01021", "01033", "01045", "01…
## $ state_fips  <fct> 01, 01, 01, 01, 01, 01, 01, 01, 01, 01, 01, 01, 01, 05, 0…
## $ county_fips <fct> 001, 009, 017, 021, 033, 045, 051, 065, 079, 083, 099, 10…
## $ name        <fct> Autauga, Blount, Chambers, Chilton, Colbert, Dale, Elmore…
## $ lsad        <fct> County, County, County, County, County, County, County, C…
## $ census_area <dbl> 594.436, 644.776, 596.531, 692.854, 592.619, 561.150, 618…
## $ state       <fct> Alabama, Alabama, Alabama, Alabama, Alabama, Alabama, Ala…
## $ iso_3166_2  <fct> AL, AL, AL, AL, AL, AL, AL, AL, AL, AL, AL, AL, AL, AR, A…
## $ range       <fct> "250 - 499", "1,000 or more", "250 - 499", "250 - 499", "…
## $ ct          <dbl> 371, 1146, 331, 463, 591, 469, 538, 393, 1252, 1156, 477,…
## $ geometry    <MULTIPOLYGON [°]> MULTIPOLYGON (((-86.49677 3..., MULTIPOLYGON…
## $ year        <chr> "2017", "2017", "2017", "2017", "2017", "2017", "2017", "…
22.3 Drawing the Map
We’re going to make a few maps, and we’ll start with looking at the farmland distribution across America:
select(y2017, fips, year, range, ct) %>%
  ggplot() +
  geom_sf(aes(fill = range), color = "#b2b2b2", size = 0.1) +
  scale_fill_brewer(
    name = "# Farms", palette = "Greens", na.value = "white", labels = ffactor, breaks = ffactor
  ) +
  coord_sf(crs = albersusa::us_laea_proj, datum = NA) +
  labs(
    x = NULL, y = NULL,
    title = "Down On The Farm: County-level Census of Agriculture Farms-per-County",
    subtitle = "While the USDA does track some 'urban farms' most of the farmland is, indeed, rural.",
    caption = "Data: USDA <www.nass.usda.gov/Publications/AgCensus>; {tigris} • #30DayMapChallenge"
  ) +
  theme_ipsum_es(grid="") +
  theme(legend.position = c(0.985, 0.5))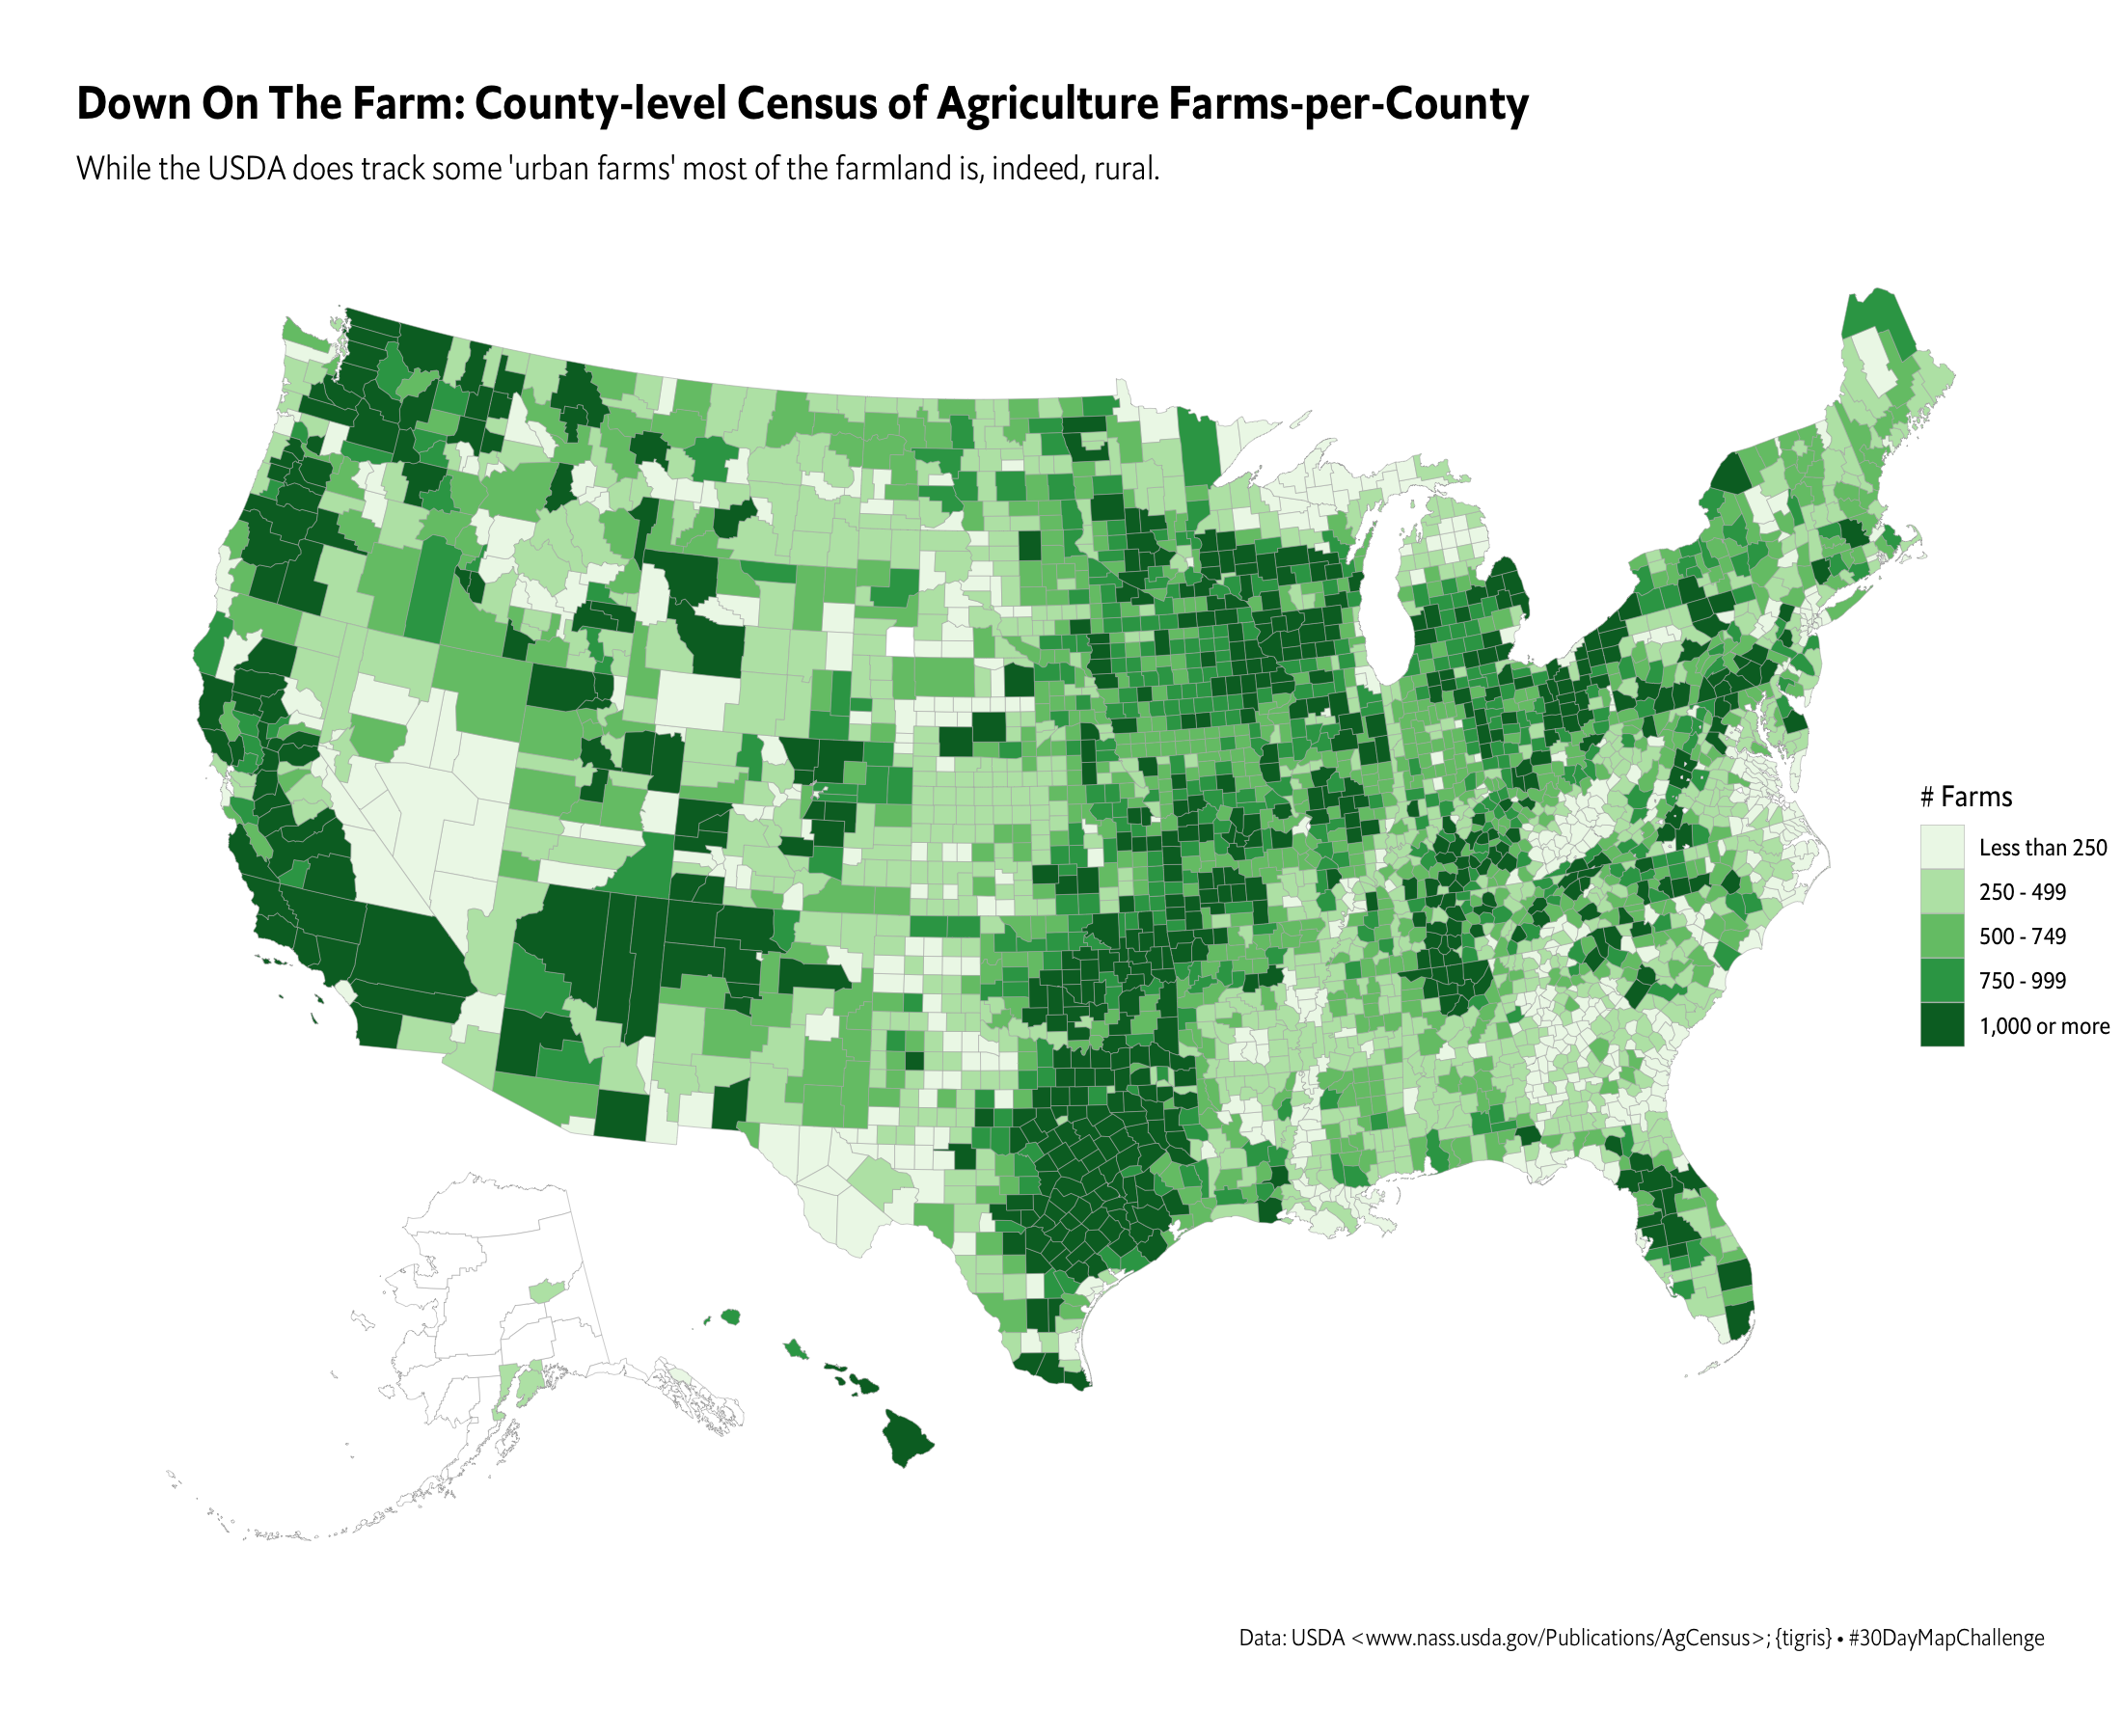
I had a working theory that the number of farms diminished since 2012 and we can take a look at that by diff’ing the counts from 2012 to 2017 and showing that county-by-county difference. We’re using a diverging color scale to help show/distinguish positive and negative values:
select(y2017, fips, y2017=ct) %>%
  left_join(
    as_tibble(y2012) %>%
      select(fips, y2012=ct)
  ) %>%
  mutate(diff = y2017-y2012) -> decline

ggplot(decline) +
  geom_sf(aes(fill = diff), color = "#b2b2b2", size = 0.1) +
  scale_fill_distiller(
    name = "Farms delta", palette = "BrBG", direction = 1, na.value = "white"
  ) +
  coord_sf(crs = albersusa::us_laea_proj, datum = NA) +
  labs(
    x = NULL, y = NULL,
    title = "Change in County Farm Counts 2012 - 2017",
    subtitle = "~63% of counties saw a decline in the number of farms since the 2012 USDA Ag Census",
    caption = "Data: USDA <www.nass.usda.gov/Publications/AgCensus>; {tigris} • #30DayMapChallenge"
  ) +
  theme_ipsum_es(grid="") +
  theme(legend.position = c(0.985, 0.5))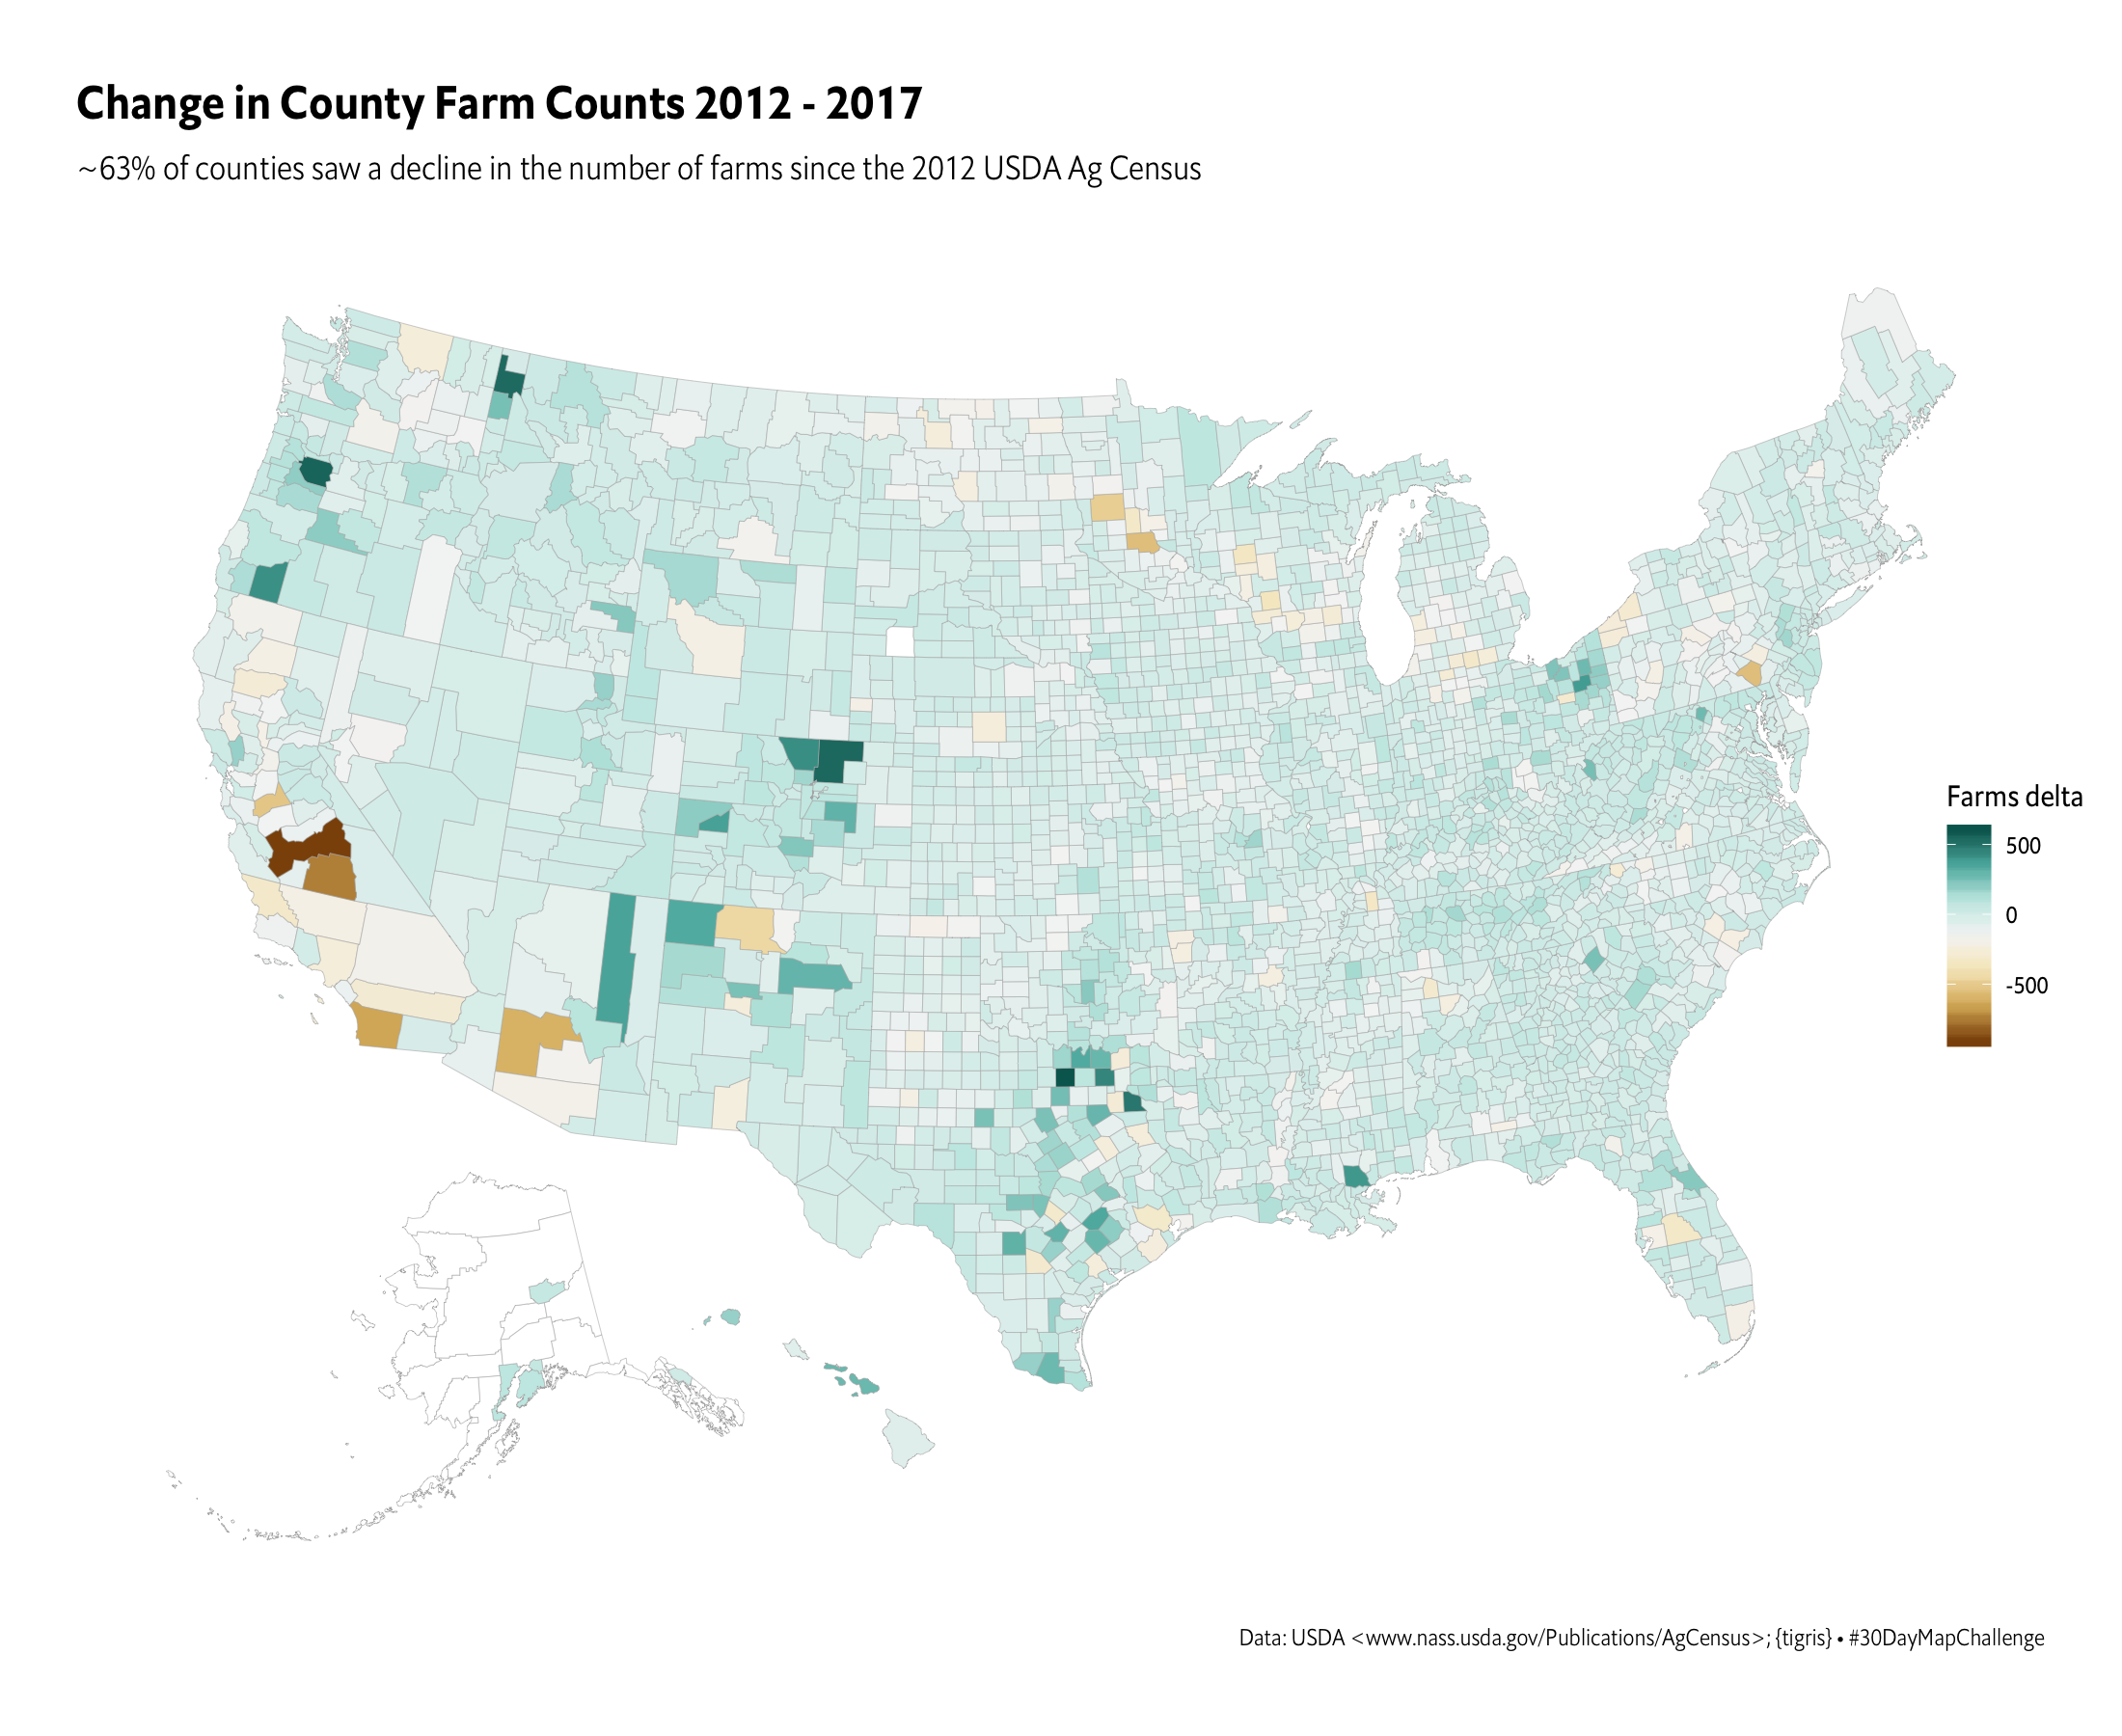
Finally, I noticed61 that the USDA also tracks “Farm Computer Usage and Ownership” every two years, and part of that dataset includes whether a farm has internet access or not.
I had to do quite a bit of data munging to extract this data and will save y’all from that nightmare. It was not a very reproducible process, so you get to just enjoy the final data product.
There hasn’t been much “cyber” in any of these challenges so we’re going to make a US map out of “geofacets” that show the increase in internet accessibility on farms per-state since 1997. This is much like using {statebins} except that there is way more data per cell. Hopefully you can make out that this is the U.S.
farm_internet <- readRDS(here::here("data/farm-internet-history.rds"))

ggplot(farm_internet) +
  geom_segment(aes(year, pct, xend=year, yend=0), color = "#66bd63") +
  scale_x_date(breaks = range(farm_internet$year), labels = c("1997", "2019")) +
  scale_y_percent(limits = c(0, 1)) +
  facet_geo(~state) +
  labs(
    x = NULL, y = NULL,
    title = "State-level Farms with Internet Access % (1997-2019)",
    subtitle = "I'll admit to being optimistic that the current % was so high across the board",
    caption = "Data: USDA <usda.library.cornell.edu/concern/publications/h128nd689>; {geofacet} • #30DayMapChallenge"
  ) +
  theme_ipsum_es(
    grid="Y", strip_text_family = font_es_bold,
    strip_text_size = 9, axis_text_size = 9
  ) +
  theme(axis.text.x = element_text(hjust = c(0, 1))) +
  theme(panel.spacing = unit(0.25, "lines"))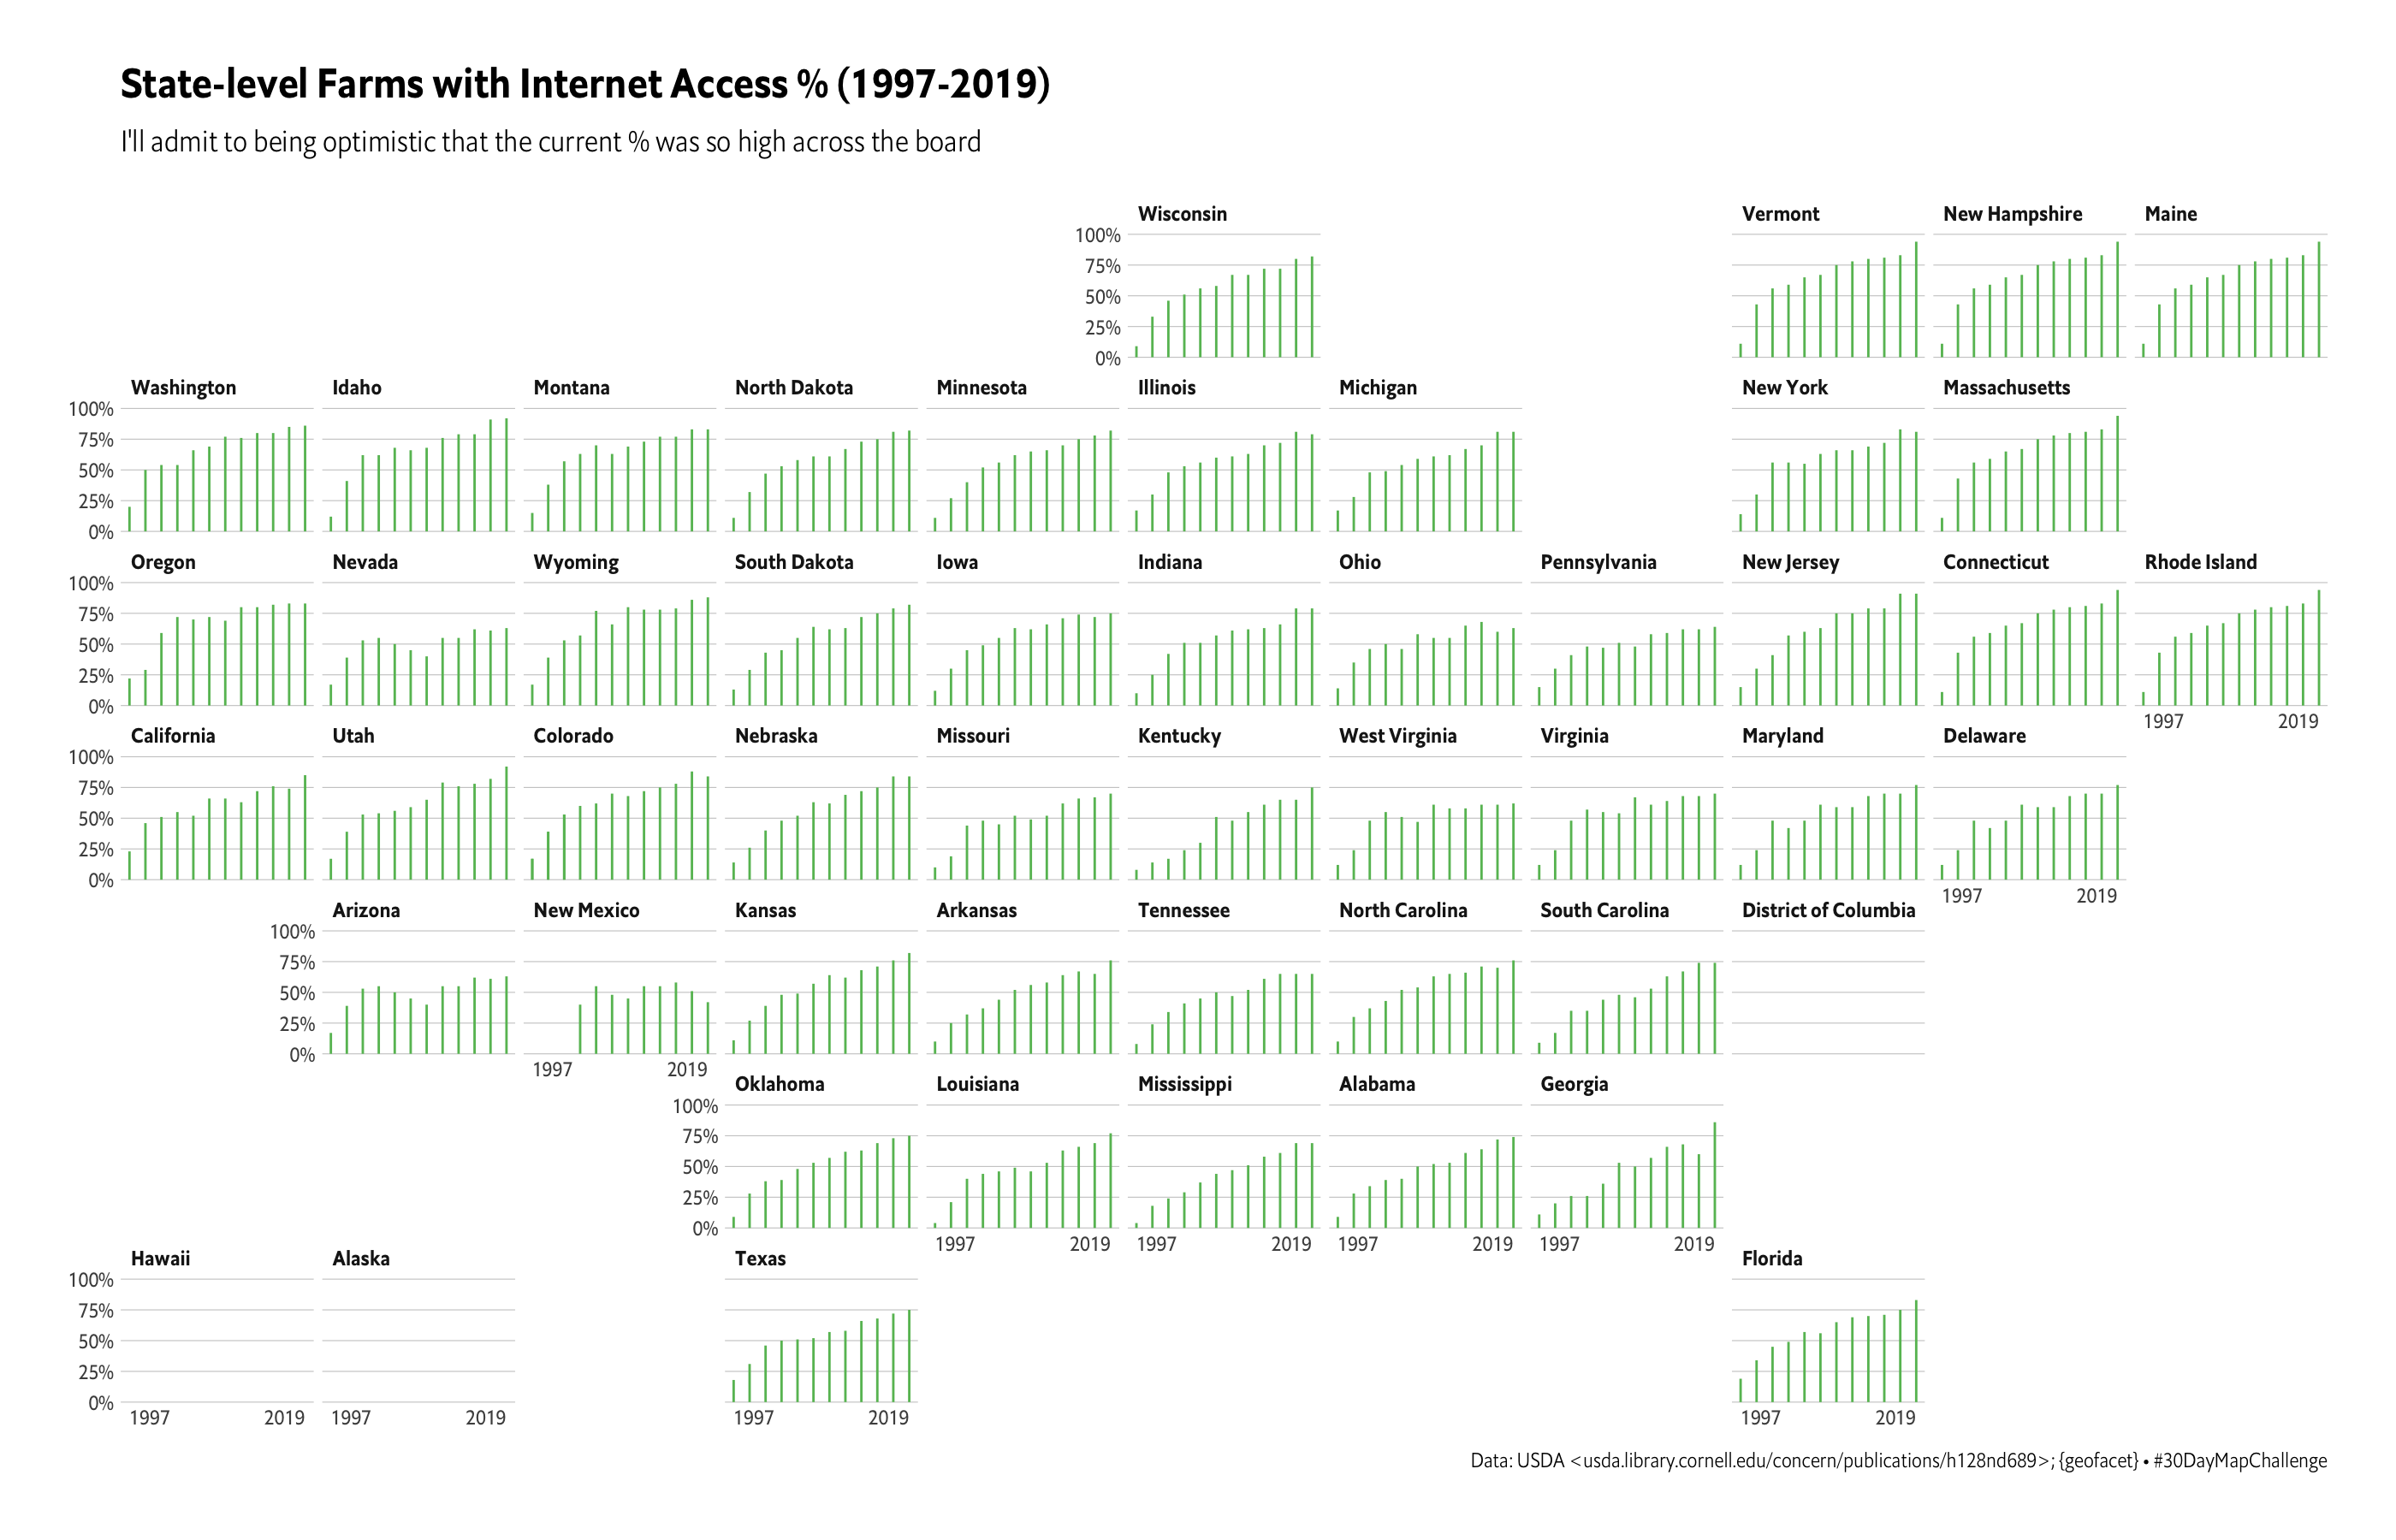
22.4 In Review
Today was a three-fer and we used choropleths to track farmland density across the U.S. and then geofacets to show internet access increases over time, proving there’s more than one way to make a “map”.
22.5 Try This At Home
Do the computation that enabled us to come up with the “63% decline” statistic (spatial data is about much more than just maps).
Read up on what the USDA census tracks and pick a different statistic (or two!) to look at.
Roll up your sleeves, grab all the ugly, terrible, awful, “Farm Computer Usage and Ownerhip” survey data and pick one of the other statistics to track and look at it with geofacets.