ggplot() +
geom_sf(data = border, color = "black", fill = NA, size = 0.5) +
geom_sf(data = maine, color = "#5c5c5c", aes(fill = n), size = 0.125, linetype = "dotted") +
geom_sf_label(
data = maine, aes(label = NAME, color = I(col)), fill = NA,
family = font_es_light, size = 4, lineheight = 0.875,
label.padding = unit(0.05, "lines"), label.size = 0,
) +
geom_sf(
data = loons_sf, aes(size = total), show.legend = "point",
shape = 21, fill = alpha("#670409", 2/3), color = "white", stroke = 0.5
) +
scale_fill_distiller(palette = "YlGn", direction = 1) +
scale_size_area() +
coord_sf(crs=albersusa::us_laea_proj, datum=NA) +
guides(
size = guide_legend(direction = "vertical"),
fill = guide_colourbar(
direction = "horizontal",
title.position = "top"
)
) +
labs(
x = NULL, y = NULL,
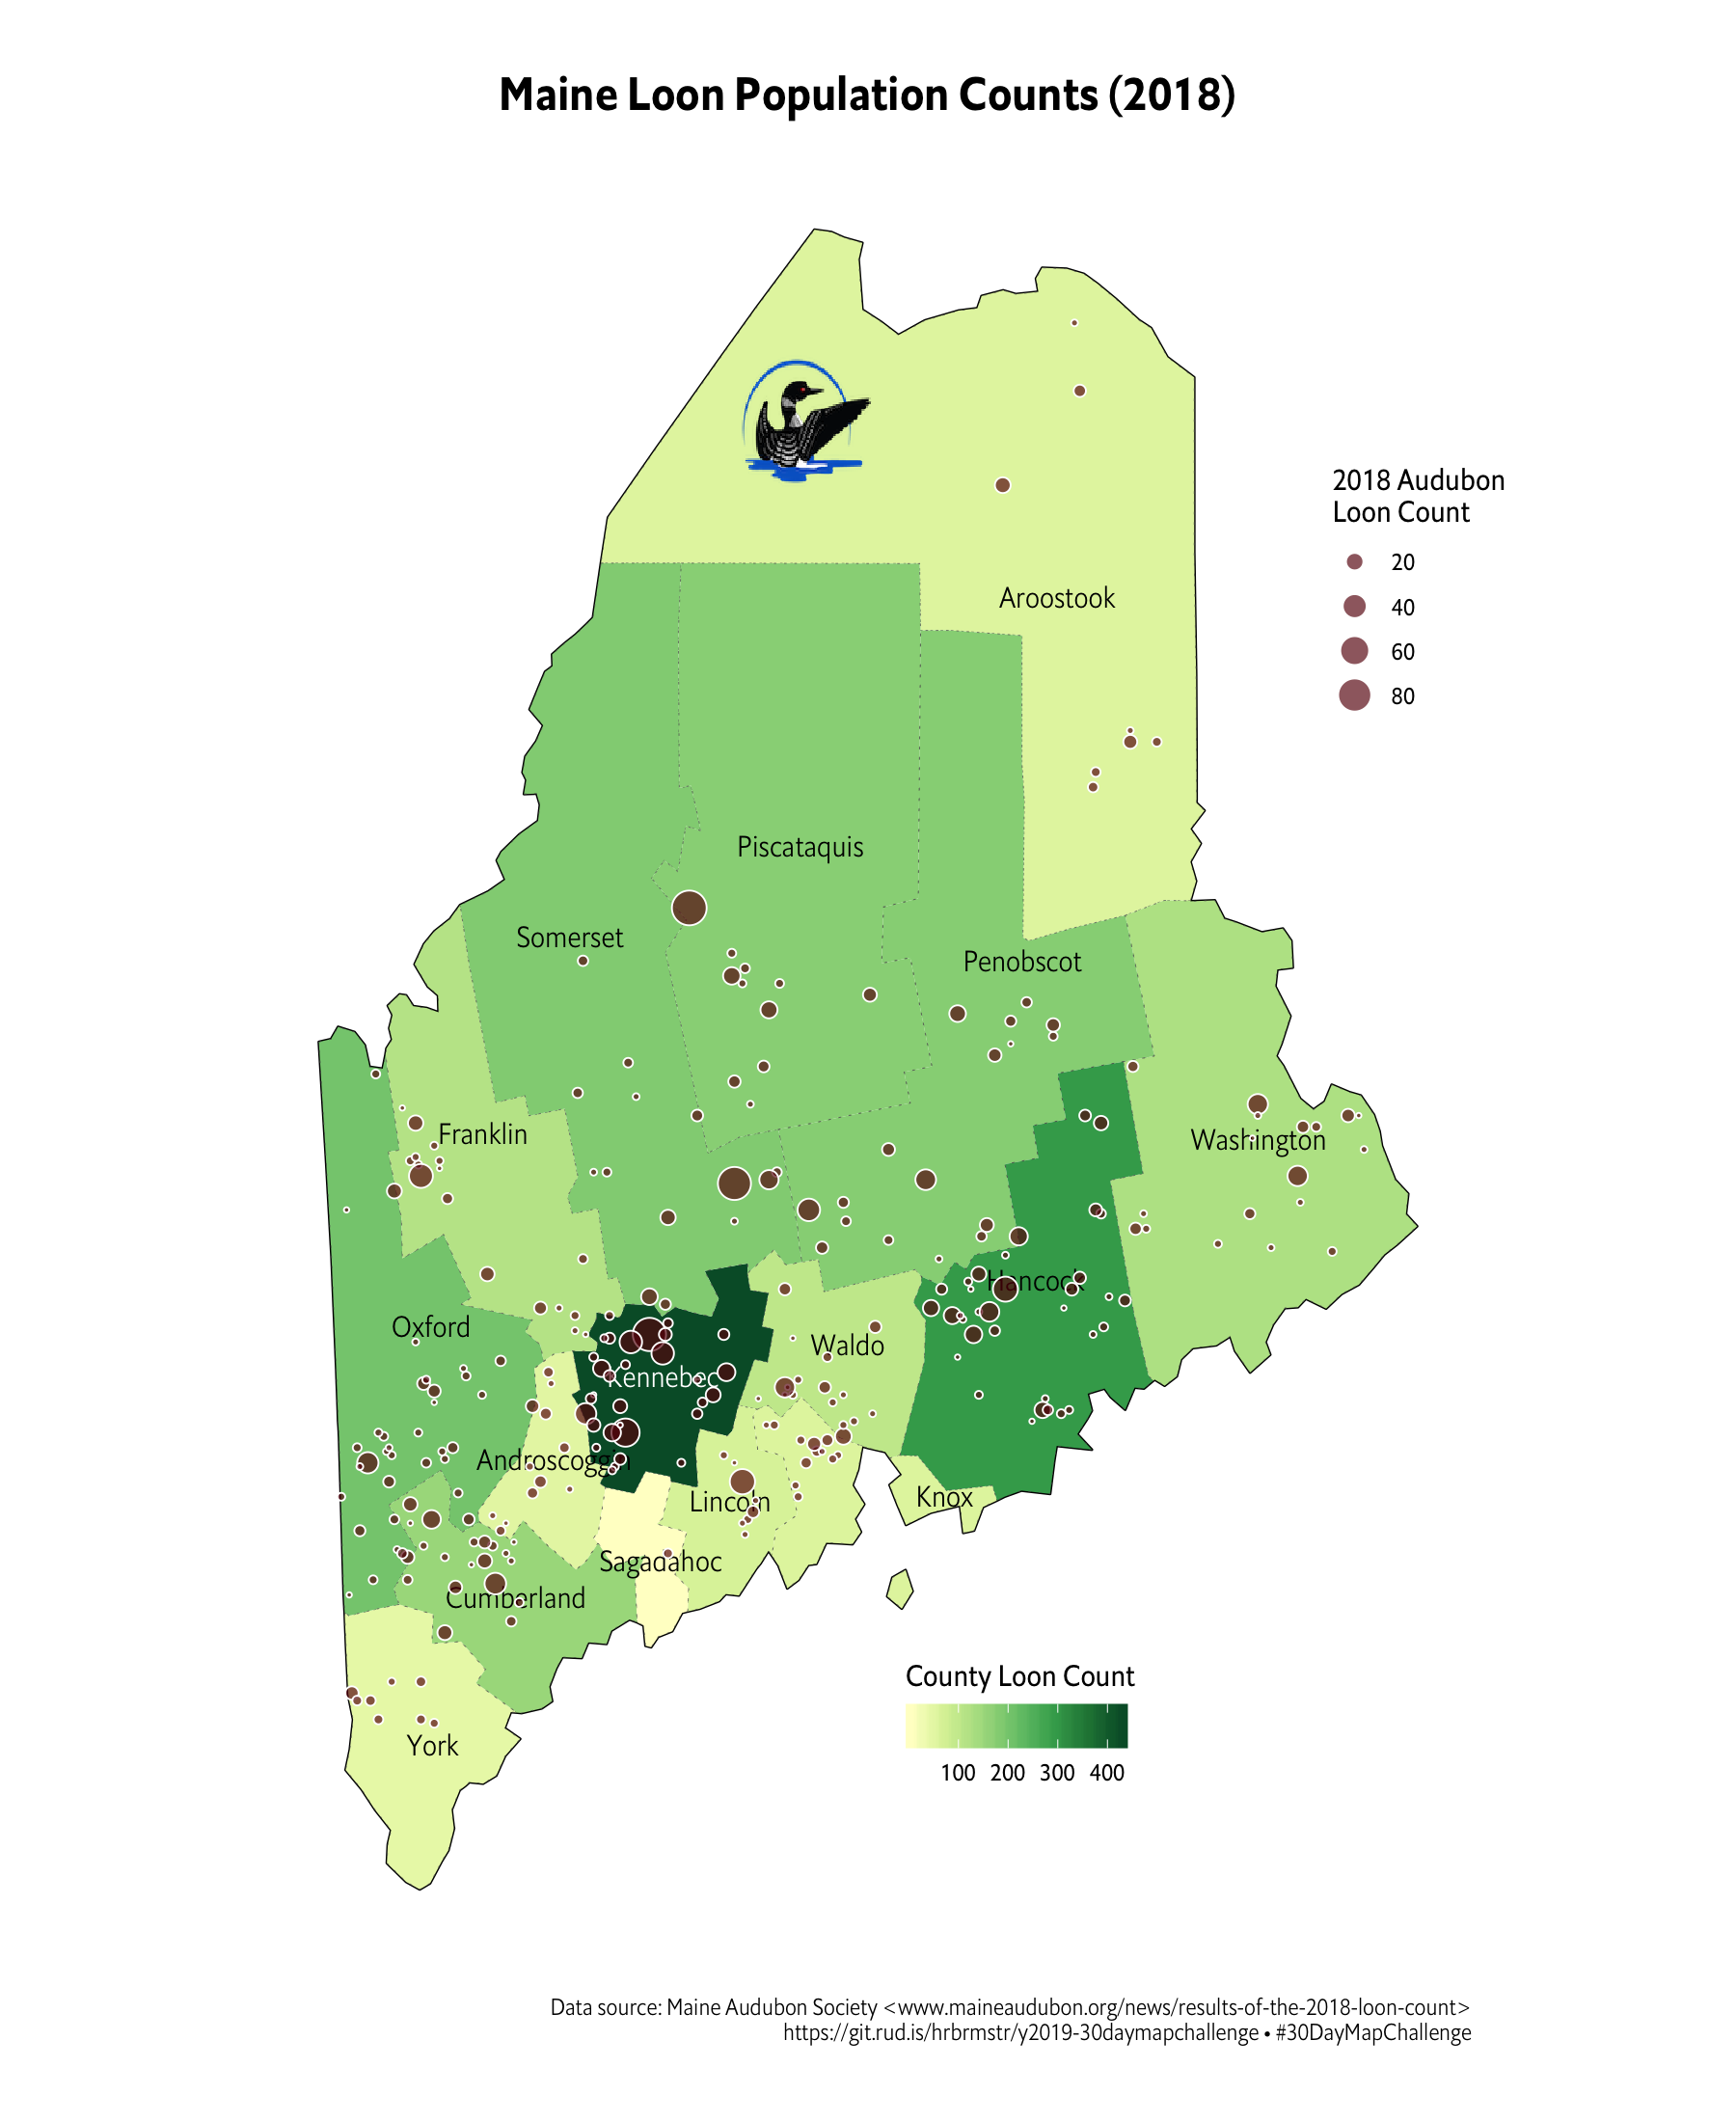
size = "2018 Audubon\nLoon Count",
fill = "County Loon Count",
title = "Maine Loon Population Counts (2018)",
caption = "Data source: Maine Audubon Society <www.maineaudubon.org/news/results-of-the-2018-loon-count>\nhttps://git.rud.is/hrbrmstr/y2019-30daymapchallenge • #30DayMapChallenge"
) +
theme_ipsum_es(grid="") +
theme(plot.title = element_text(hjust = 0.5)) -> gg
legends <- gtable_filter(ggplot_gtable(ggplot_build(gg)), "guide-box")
ggplot() +
geom_sf(data = border, color = "black", fill = NA, size = 0.5) +
geom_sf(data = maine, color = "#5c5c5c", aes(fill = n), size = 0.125, linetype = "dotted") +
geom_image(
data = data.frame(),
aes(x = -69.25, y = 46.95, image = here::here("data/loon.png")),
size = 0.1
) +
geom_sf_label(
data = maine, aes(label = NAME, color = I(col)), fill = NA,
family = font_es_light, size = 4, lineheight = 0.875,
label.padding = unit(0.05, "lines"), label.size = 0,
) +
geom_sf(
data = loons_sf, aes(size = total), show.legend = "point",
shape = 21, fill = alpha("#670409", 2/3), color = "white", stroke = 0.5
) +
annotation_custom( # loons/size
legends$grobs[[1]]$grobs[[1]],
xmin = -67, xmax = -66.8854, ymin = 46, ymax = 47
) +
annotation_custom( # county/fill
legends$grobs[[1]]$grobs[[2]],
xmin = -71, xmax = -65.8854, ymin = 42, ymax = 45
) +
scale_fill_distiller(palette = "YlGn", direction = 1) +
scale_size_area() +
coord_sf(crs=albersusa::us_longlat_proj, datum=NA) +
labs(
x = NULL, y = NULL,
size = "2018 Audubon Loon Count",
fill = "County Loon Count",
title = "Maine Loon Population Counts (2018)",
caption = "Data source: Maine Audubon Society <www.maineaudubon.org/news/results-of-the-2018-loon-count>\nhttps://git.rud.is/hrbrmstr/y2019-30daymapchallenge • #30DayMapChallenge"
) +
theme_ipsum_es(grid="") +
theme(legend.position = "none") +
theme(plot.title = element_text(hjust = 0.5))