24 Day 22: Built Environment
24.1 Technologies/Techniques
- More geodatabase machinations
- Working with
{tigris} - More work on stylizing maps
- Using
{sf}/geom_sf()
24.2 Data Source: EPA “Walkability” Data
# https://www.epa.gov/smartgrowth/smart-location-mapping#walkability
# https://catalog.data.gov/dataset/walkability-index

st_read(here::here("data/me-counties.json")) %>%
  st_set_crs(4326) %>%
  st_transform("+proj=longlat +datum=WGS84 +no_defs") -> maine
## Reading layer `cb_2015_maine_county_20m' from data source `/Users/hrbrmstr/books/30-day-map-challenge/data/me-counties.json' using driver `TopoJSON'
## Simple feature collection with 16 features and 10 fields
## geometry type:  MULTIPOLYGON
## dimension:      XY
## bbox:           xmin: -71.08434 ymin: 43.05975 xmax: -66.9502 ymax: 47.45684
## epsg (SRID):    NA
## proj4string:    NA

filter(maine, NAME == "York") -> york

border <- st_union(maine)

if (!all(file.exists(here::here("data", c("me-walkies.rds", "york-walkies.rds"))))) {

  download.file( # NOTE THIS IS ~1 GB uncompressed
    url = "ftp://newftp.epa.gov/EPADataCommons/OP/WalkabilityIndex.zip",
    destfile = here::here("data/WalkabilityIndex.zip")
  )

  unzip(
    zipfile = here::here("data/WalkabilityIndex.zip"),
    exdir = here::here("data/WalkabilityIndex")
  )

  # this may take a bit to read in
  walkies <- st_read(here::here("data/WalkabilityIndex/Natl_WI.gdb/"), "WalkabilityIndex")

  # find the maine walkability
  me_walkies <- st_intersection(walkies, border)

  # find just york county
  york_walkies <- st_intersection(me_walkies, york)

  # save our hard/time-consuming work
  saveRDS(me_walkies, here::here("data/me-walkies.rds"))
  saveRDS(york_walkies, here::here("data/york-walkies.rds"))

}

me_walkies <- readRDS(here::here("data/me-walkies.rds"))
york_walkies <- readRDS(here::here("data/york-walkies.rds"))

rivers <- linear_water(state = "ME", "York", class="sf")
water <- area_water(state = "ME", "York", class = "sf")
rd <- roads(state = "ME", "York", class = "sf")

st_read(here::here("data/me-topo.geojson")) %>%
  st_set_crs(4326) %>%
  st_transform("+proj=longlat +datum=WGS84 +no_defs") -> towns
## Reading layer `me' from data source `/Users/hrbrmstr/books/30-day-map-challenge/data/me-topo.geojson' using driver `TopoJSON'
## Simple feature collection with 985 features and 1 field
## geometry type:  POLYGON
## dimension:      XY
## bbox:           xmin: -71.08015 ymin: 43.06516 xmax: -66.95141 ymax: 47.4599
## epsg (SRID):    NA
## proj4string:    NA

st_intersection(st_buffer(towns, 0), york) %>%
  mutate(
    id = as.character(id),
    id = case_when(
      id == "NorthBerick" ~ "North\nBerwick",
      id == "SouthBerick" ~ "South\nBerwick",
      id == "Sandford" ~ "Sanford",
      id == "SacoCty" ~ "Saco",
      id == "BiddefordCty" ~ "Biddeford",
      id == "OldOrchardBeach" ~ "Old Orchard\nBeach",
      TRUE ~ id
    )
  ) -> york_towns
24.3 Drawing the Map
ggplot() +
  geom_sf(data = border, color = "black", size = 0.75, fill=NA) +
  geom_sf(data = me_walkies, color = "white", size = 0.0725, aes(fill = WalkIndex)) +
  geom_sf(data = maine, color = "#2b2b2b", size = 0.25, fill = NA) +
  geom_sf_label(
    data = maine, aes(label = NAME), family = font_es_bold, size = 4, lineheight = 0.875,
    label.padding = unit(0.05, "lines"), label.size = 0, fill = "#ffffff33"
  ) +
  scale_fill_viridis_c(
    direction = -1, limits = c(0,20), name = "Walkability Index\n",
    breaks = seq(0, 20, 5), labels = c("0 (Nigh impassable)", 5, 10, 15, "20 (Very walkable)")
  ) +
  coord_sf(crs=albersusa::us_laea_proj, datum=NA) +
  labs(
    x = NULL, y = NULL,
    title = "Walkability (At The Macro-Level) In Maine",
    caption = "Data source: <catalog.data.gov/dataset/walkability-index>; {tigris} • #30DayMapChallenge"
  ) +
  theme_ipsum_es(grid="") +
  theme(plot.title = element_text(hjust = 0.5)) +
  theme(legend.position = c(0.85, 0.25)) +
  theme(legend.title = element_text(family = font_es_bold, hjust = 0.5)) +
  theme(legend.box.background = element_rect(color = "#2b2b2b", fill = "white"))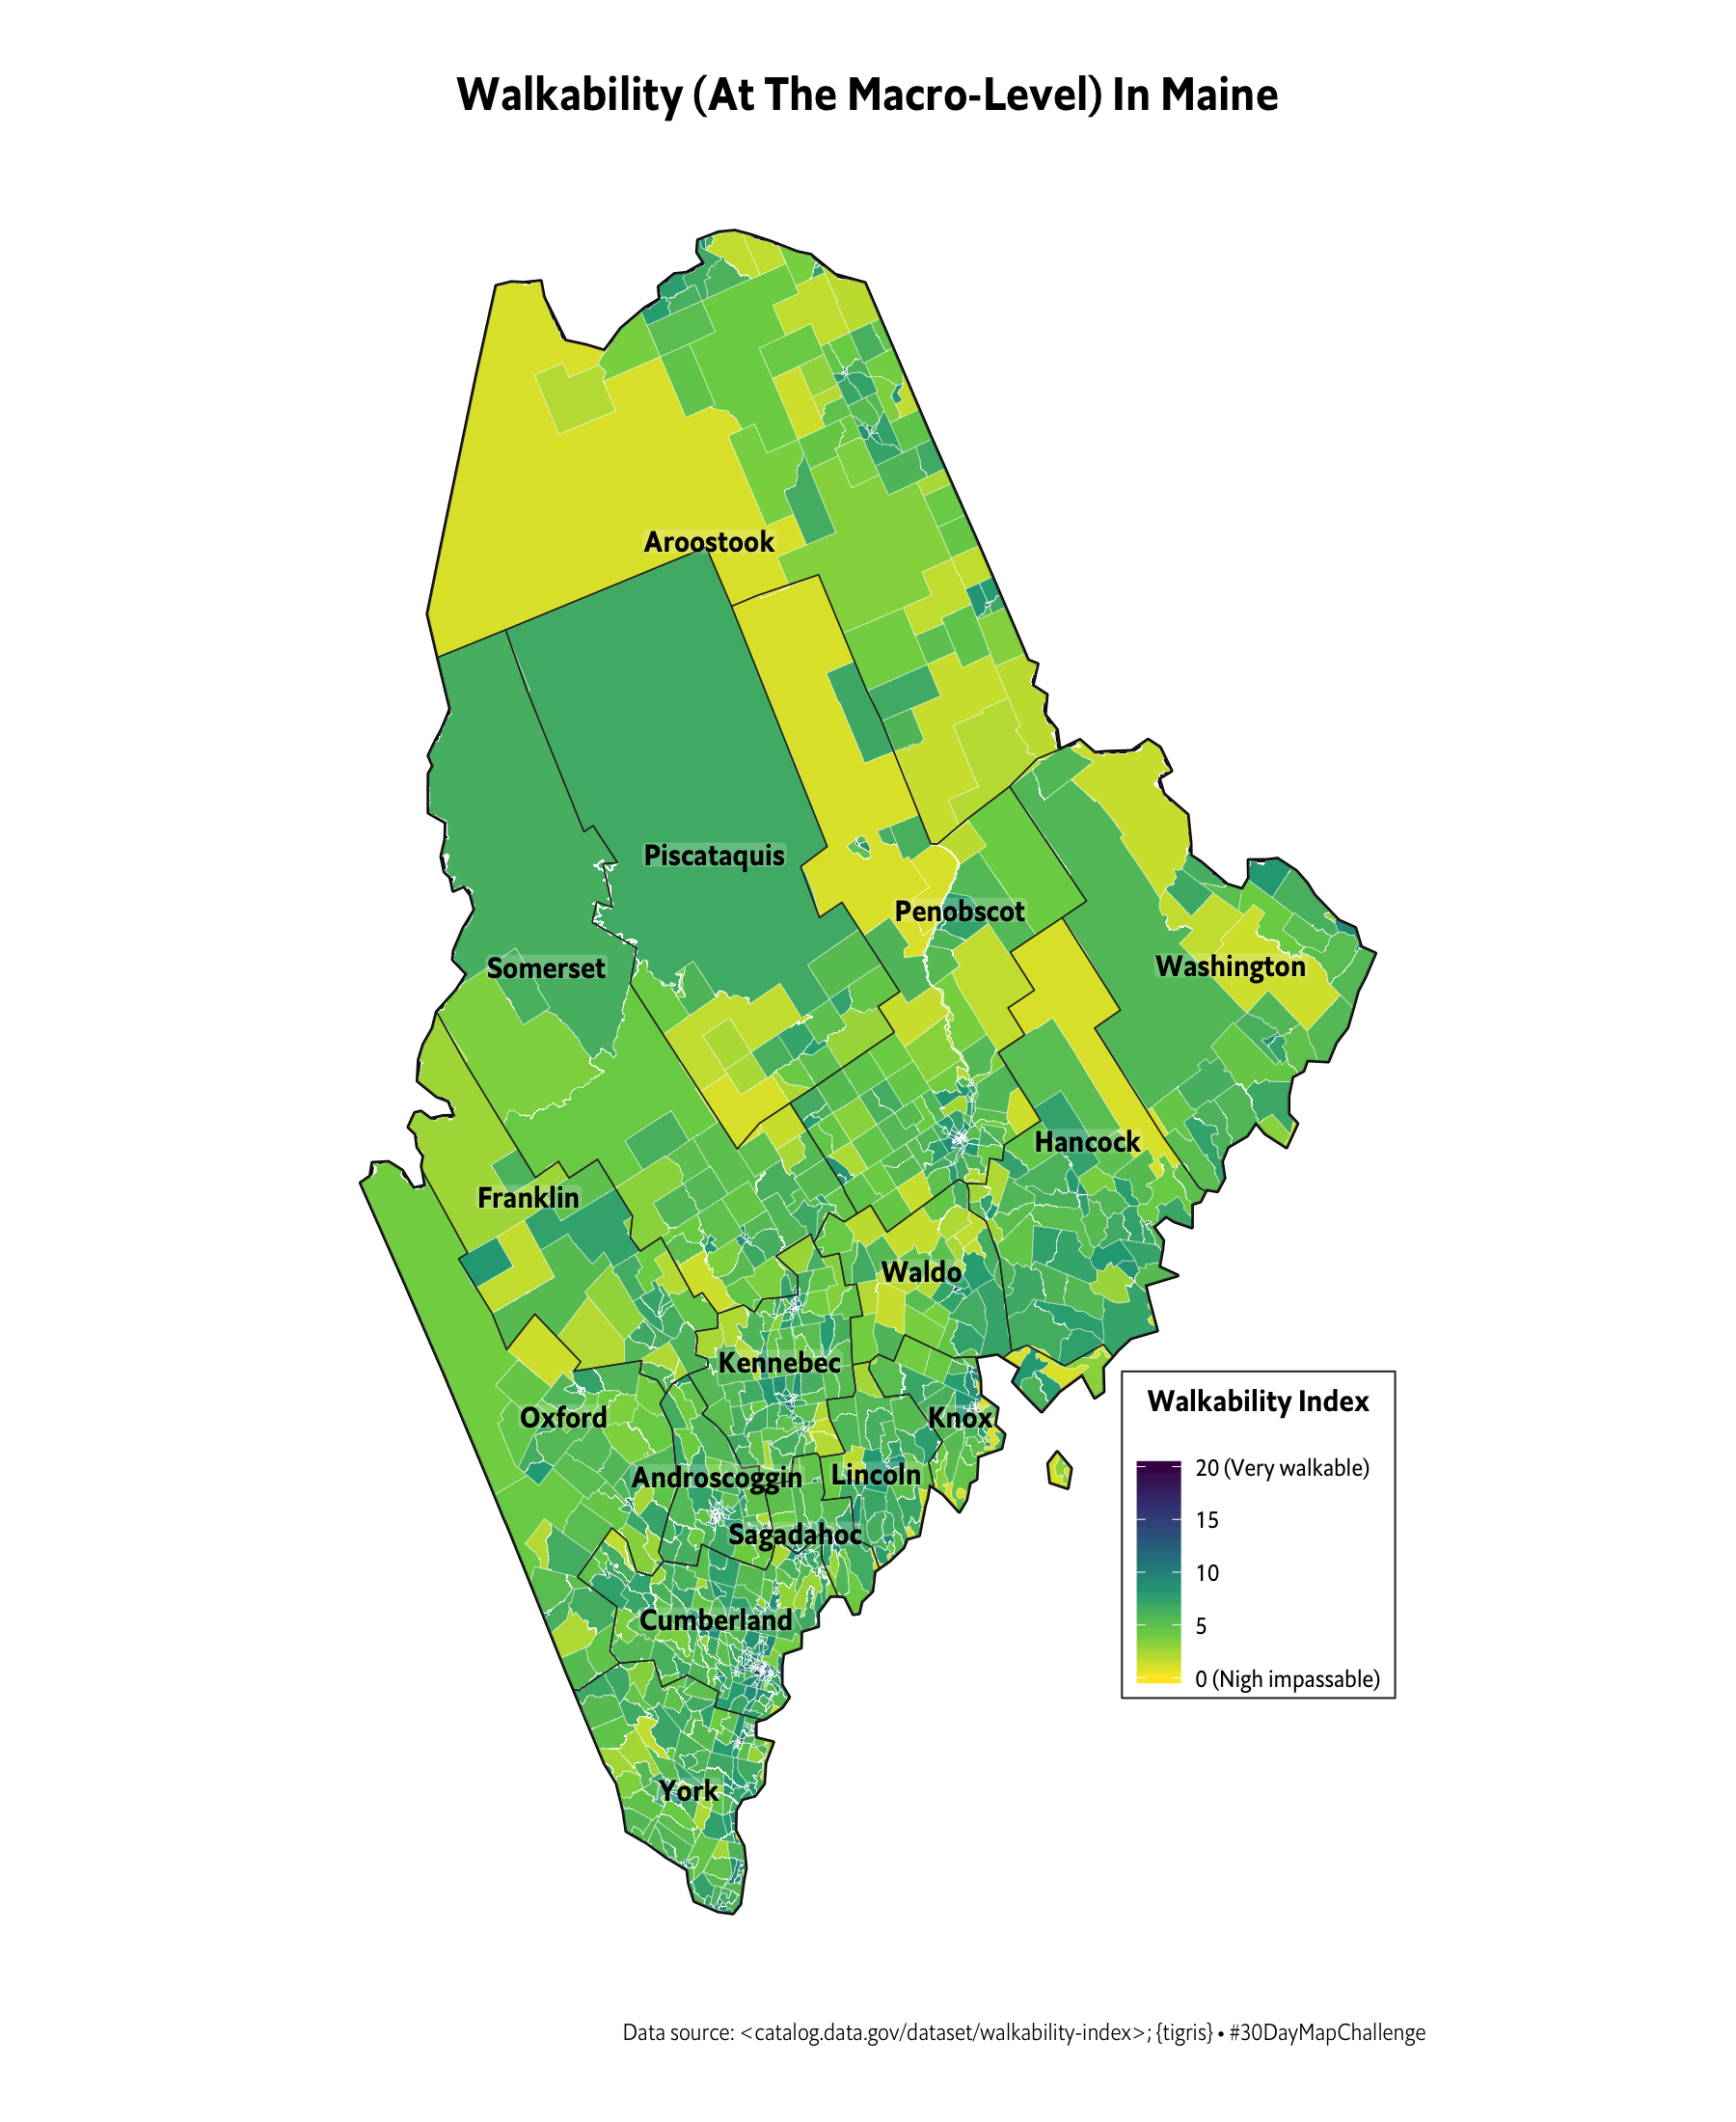
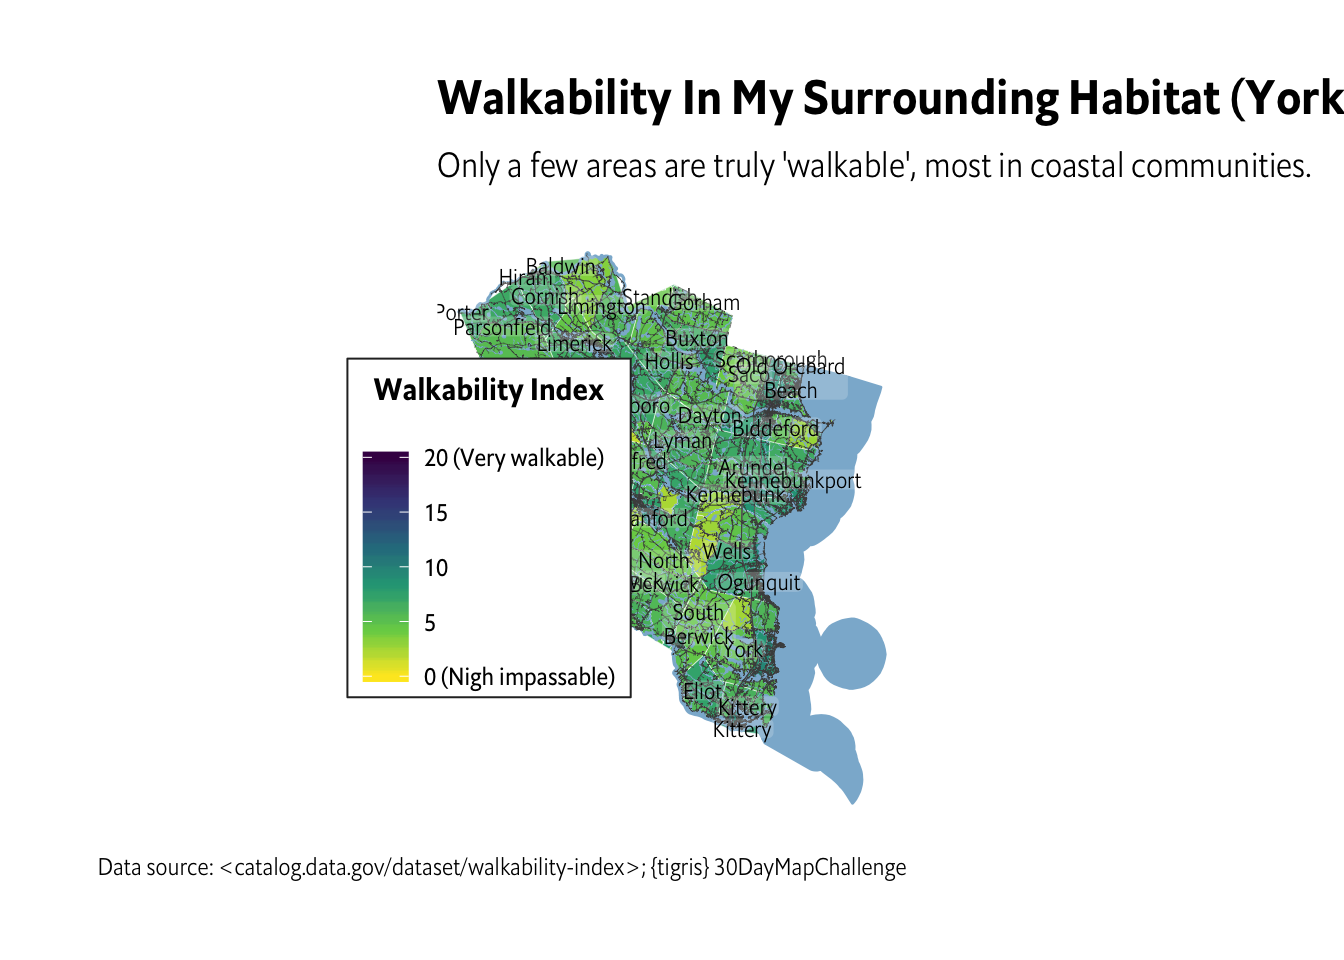
ggplot() +
  geom_sf(data = york_walkies, aes(fill = WalkIndex), color = "white", size = 0.1) +
  geom_sf(data = water, fill = "#8cb6d3", color = "#8cb6d3") +
  geom_sf(data = rivers, size = 0.1, color = "#8cb6d3") +
  geom_sf(data = rd, size = 0.1, color = "#4c4c4c") +
  geom_sf_label(
    data = york_towns, aes(label = id), family = font_es_light, size = 3, lineheight = 0.875,
    label.padding = unit(0.05, "lines"), label.size = 0, fill = "#ffffff33"
  ) +
  scale_fill_viridis_c(
    direction = -1, limits = c(0,20), name = "Walkability Index\n",
    breaks = seq(0, 20, 5), labels = c("0 (Nigh impassable)", 5, 10, 15, "20 (Very walkable)")
  ) +
  coord_sf(crs=albersusa::us_laea_proj, datum=NA) +
  labs(
    x = NULL, y = NULL,
    title = "Walkability In My Surrounding Habitat (York County, Maine)",
    subtitle = "Only a few areas are truly 'walkable', most in coastal communities.",
    caption = "Data source: <catalog.data.gov/dataset/walkability-index>; {tigris} 30DayMapChallenge"
  ) +
  theme_ipsum_es(grid="") +
  theme(legend.position = c(0.11, 0.5)) +
  theme(legend.title = element_text(family = font_es_bold, hjust = 0.5)) +
  theme(legend.box.background = element_rect(color = "#2b2b2b", fill = "white"))