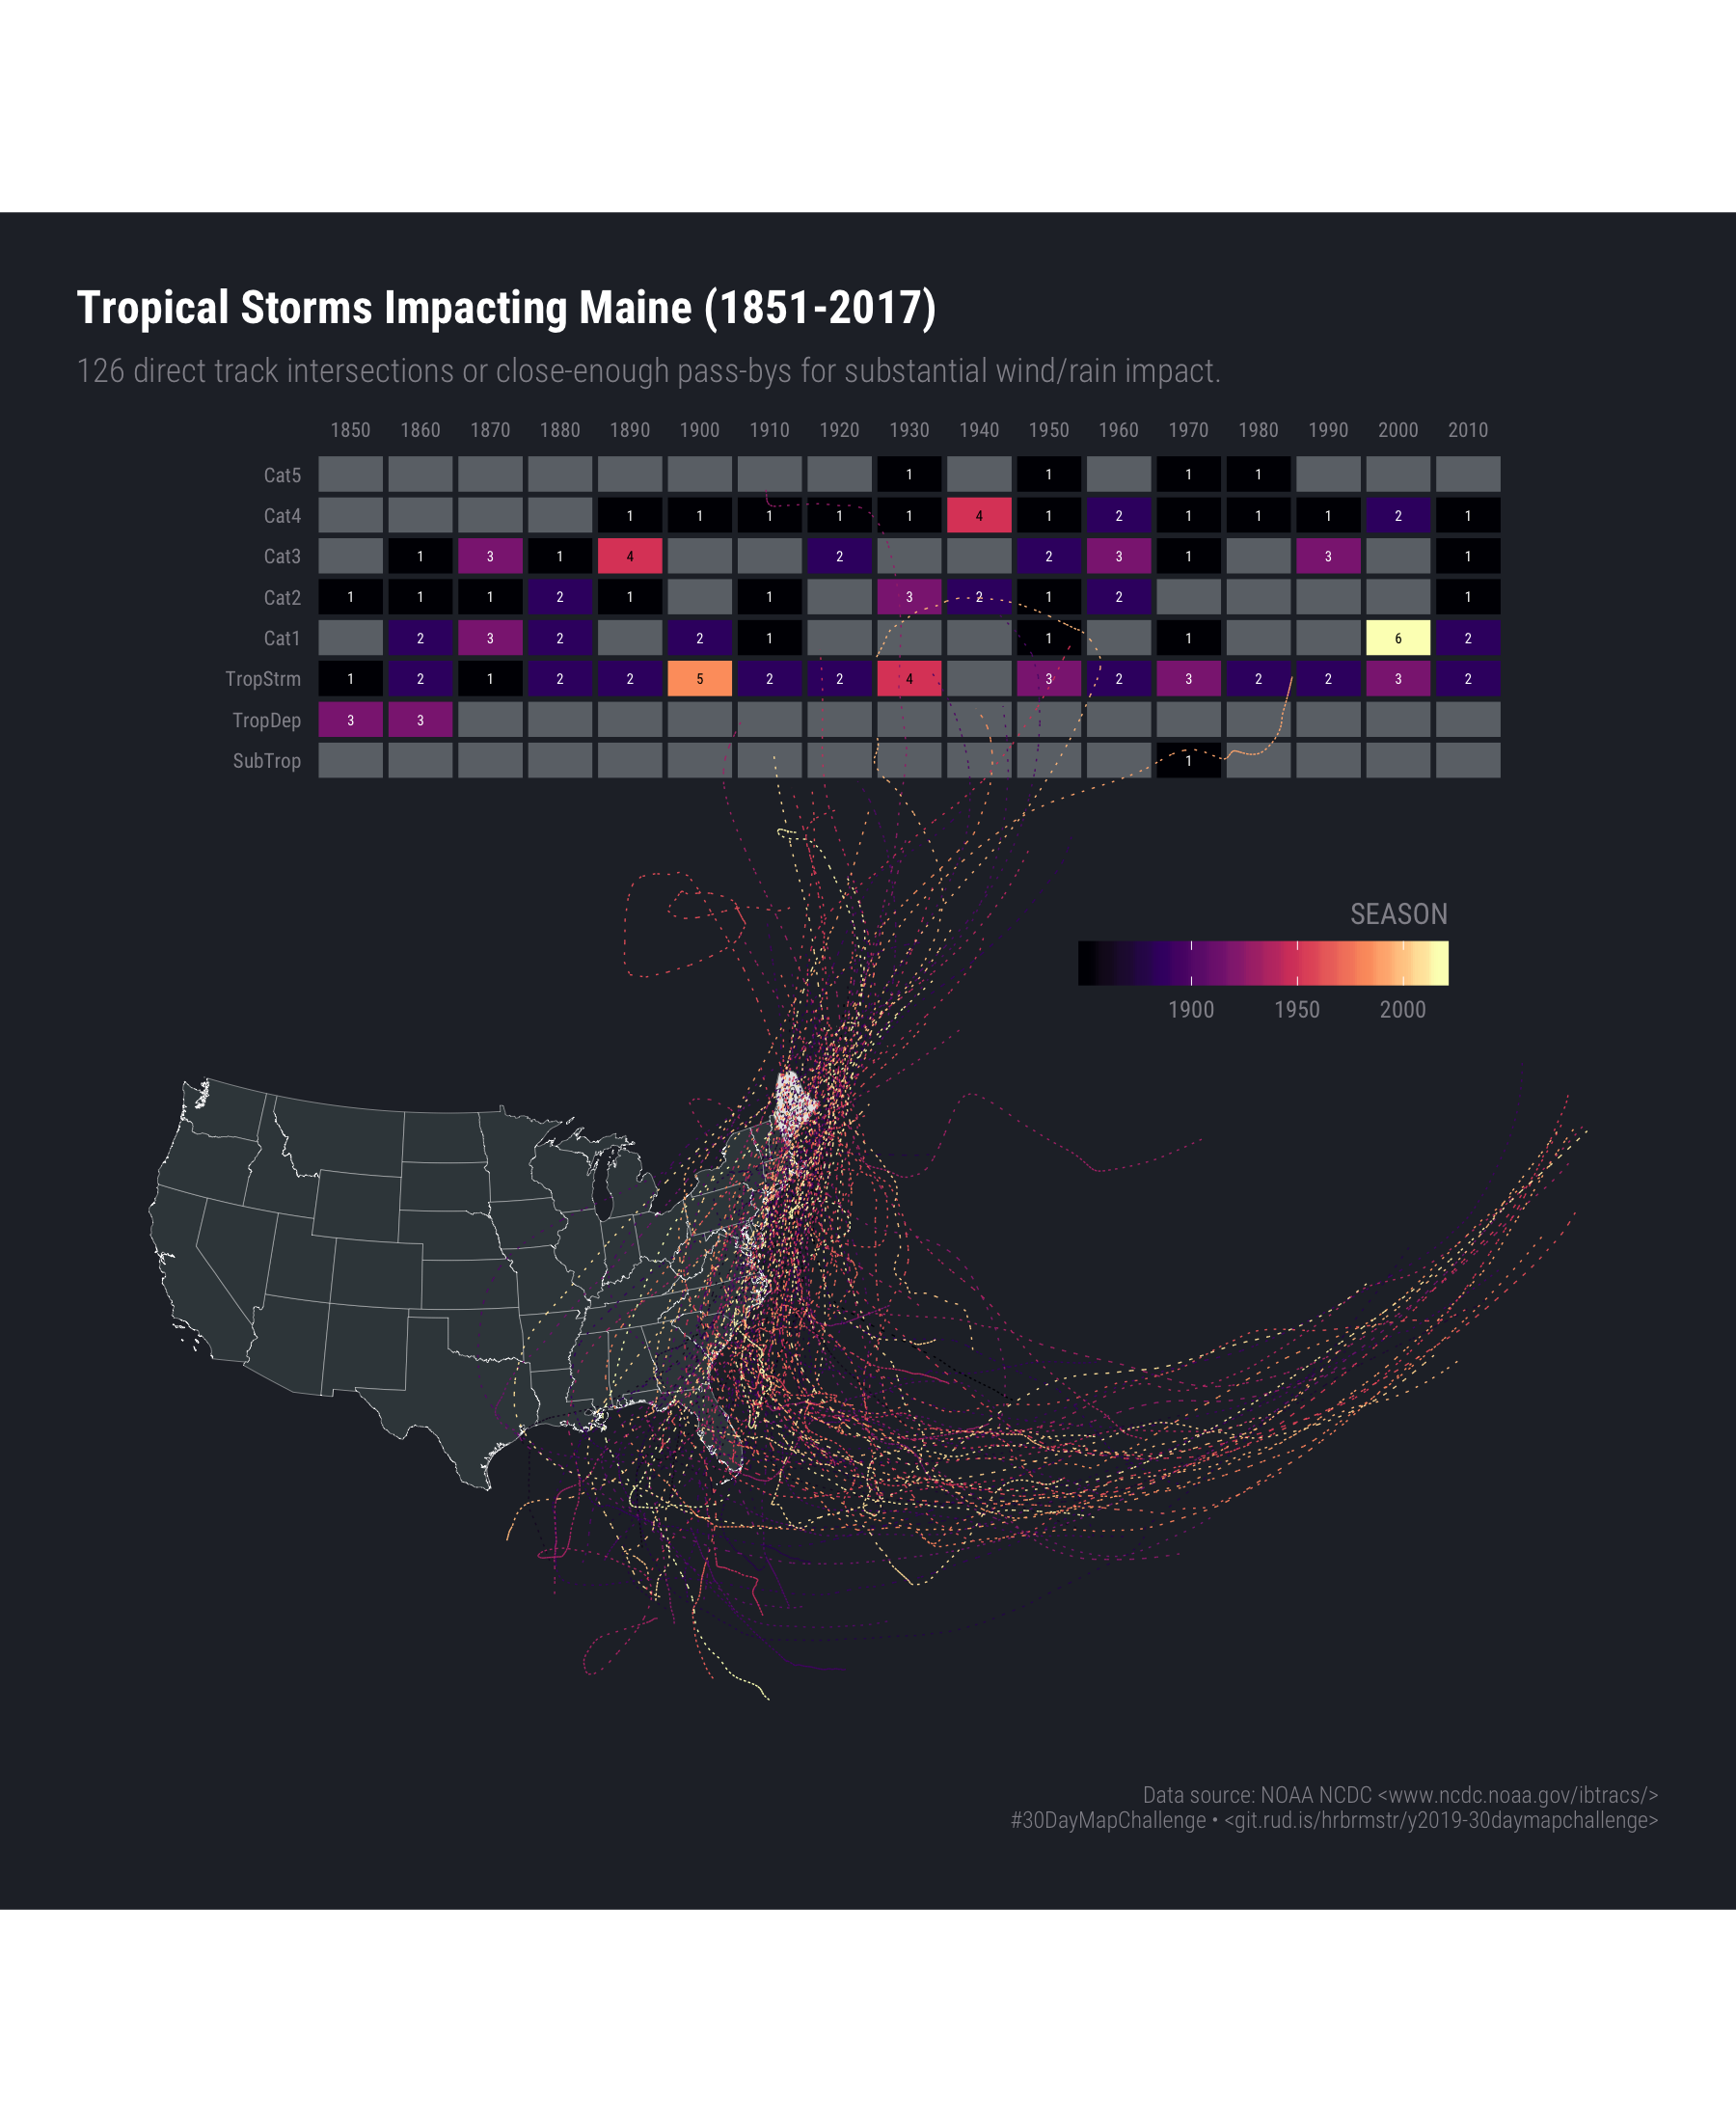
st_read(here::here("data/me-counties.json")) %>%
  st_set_crs(4326) %>%
  st_transform(albersusa::us_laea_proj) -> maine
## Reading layer `cb_2015_maine_county_20m' from data source `/Users/hrbrmstr/books/30-day-map-challenge/data/me-counties.json' using driver `TopoJSON'
## Simple feature collection with 16 features and 10 fields
## geometry type:  MULTIPOLYGON
## dimension:      XY
## bbox:           xmin: -71.08434 ymin: 43.05975 xmax: -66.9502 ymax: 47.45684
## epsg (SRID):    NA
## proj4string:    NA

ne_states("united states of america", returnclass = "sf") %>%
  filter(!(postal %in% c("AK", "HI"))) %>%
  st_transform(albersusa::us_laea_proj) -> states

if (!file.exists(here::here("data/IBTrACS.ALL.list.v04r00.lines.zip"))) {

  download.file(
    "https://www.ncei.noaa.gov/data/international-best-track-archive-for-climate-stewardship-ibtracs/v04r00/access/shapefile/IBTrACS.ALL.list.v04r00.lines.zip",
    here::here("data/IBTrACS.ALL.list.v04r00.lines.zip")
  )

  unzip(
    here::here("data/IBTrACS.ALL.list.v04r00.lines.zip"),
    exdir = here::here("data/ibtracs")
  )

  ibtracs <- st_read(here::here("data/ibtracs/IBTrACS.ALL.list.v04r00.lines.shp"))
  ibtracs <- st_transform(ibtracs, albersusa::us_laea_proj)

  me_impacts <- st_intersects(ibtracs, st_buffer(st_union(maine), 200000), sparse = FALSE)
  me_impacts <- as.logical(me_impacts)

  me_hur <- filter(ibtracs, me_impacts)
  me_hur <- filter(ibtracs, SID %in% unique(me_hur$SID))

  group_by(me_hur, SID, SEASON) %>%
    summarise(do_union = FALSE) %>%
    st_cast("MULTILINESTRING") %>%
    ungroup() -> me_hur

  ibtracs %>%
    as_tibble() %>%
    filter(SID %in% me_hur$SID) %>%
    group_by(SID) %>%
    summarise(
      mt = max(USA_SSHS),
      start = min(anytime::anytime(as.character(ISO_TIME))),
      dec = lubridate::year(start) - (lubridate::year(start) %% 10)
    ) %>%
    count(dec, mt) %>%
    mutate(
      dec = factor(dec, levels = seq(min(dec), max(dec), 10)),
      mt = factor(mt, levels = c(-2, -1, 0, 1, 2, 3, 4, 5),
                  labels = c("SubTrop", "TropDep", "TropStrm", "Cat1", "Cat2", "Cat3", "Cat4", "Cat5"),
                  ordered = TRUE)
    ) %>%
    complete(dec, mt) %>%
    filter(!is.na(mt)) -> cat_by_dec

  saveRDS(me_hur, here::here("data/me-hur.rds"))
  saveRDS(cat_by_dec, here::here("data/cat-by-dec.rds"))

}

me_hur <- readRDS(here::here("data/me-hur.rds"))
cat_by_dec <- readRDS(here::here("data/cat-by-dec.rds"))
