Skip navigation

Category Archives: Development

Avast me hearRties! (ok, enough of the pirate speak in a blog post)

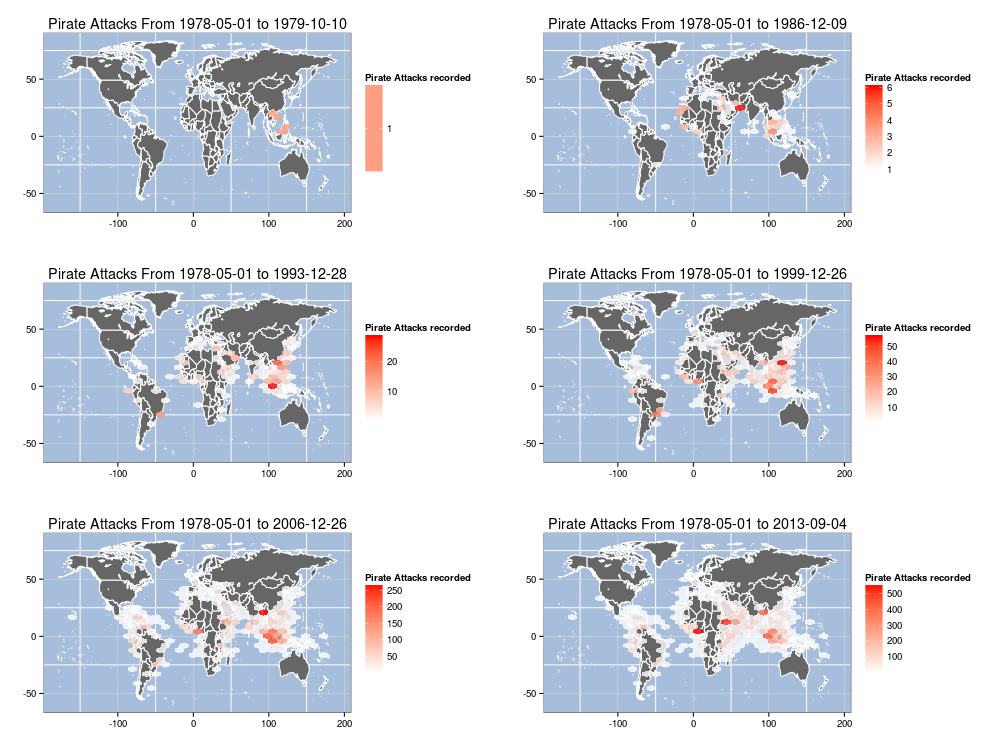
It wouldn’t be TLAPD without out some modest code & idea pilfering from Mark Bulling & Simon Raper. While those mateys did a fine job hoisting up some R code (your really didn’t think I’d stop with the pirate speak, did you?) for their example, I took it one step furrrrther to build an animation of cumulative, yearly IRL pirate attacks from 1978 to the present. I found it a bit interesting to see how the hotspots shifted over time. Click on the graphic for the largeR version or I’ll make ye walk the plank!!.

ARRRRRRR!

library(maps)
library(hexbin)
library(maptools)
library(ggplot2)
library(sp)
library(mapproj)
 
# piRate the data from the militaRy
download.file("http://msi.nga.mil/MSISiteContent/StaticFiles/Files/ASAM_shp.zip", destfile="ASAM_shp.zip")
unzip("ASAM_shp.zip")
 
# extRact the data fRame we need fRom the shape file
pirates.df <- as.data.frame(readShapePoints("ASAM 19 SEP 13")) # you may need to use a diffeRent name depending on d/l date
 
# get the woRld map data
world <- map_data("world")
world <- subset(world, region != "Antarctica") # inteRcouRse AntaRctica
 
# yeaRs we want to loop thoRugh
ends <- 1979:2013
 
# loop thRough, extRact data, build plot, save plot: BOOM
for (end in ends) {
  png(filename=sprintf("arrr-%d.png",end),width=500,height=250,bg="white") # change to 1000x500 or laRgeR
  dec.df <- pirates.df[pirates.df$DateOfOcc > "1970-01-01" & pirates.df$DateOfOcc < as.Date(sprintf("%s-12-31",end)),] 
  rng <- range(dec.df$DateOfOcc)
  p <- ggplot() 
  p <- p + geom_polygon(data=world, aes(x=long, y=lat, group=group), fill="gray40", colour="white")
  p <- p + stat_summary_hex(fun="length", data=dec.df, aes(x=coords.x1, y=coords.x2, z=coords.x2), alpha=0.8)
  p <- p + scale_fill_gradient(low="white", high="red", "Pirate Attacks recorded")
  p <- p + theme_bw() + labs(x="",y="", title=sprintf("Pirate Attacks From %s to %s",rng[1],rng[2]))
  p <- p + theme(panel.background = element_rect(fill='#A6BDDB', colour='white'))
  print(p)
  dev.off()
}
 
# requires imagemagick
system("convert -delay 45 -loop 0 arrr*g arrr500.gif")

Having received a couple follow-ups to the OS X notifications on RStudio Desktop for the Mac post, I was determined to find a quick hack to get remote notifications to OS X working from (at least) RStudio Server instances running on the same network. It turns out the hack was pretty straightforward just by using a combination of Growl and gntp-send.

To preempt detractors: Yes, Growl isn’t free for newer versions of OS X; but $3.99USD is worth skipping a frappuccino for if you desire this functionality (IMO). I’ve had Growl running since before there was an app store and it’s far more hackable than the Notification Center is (as demonstrated by this post).

You’ll need to configure Growl to listen for incoming connections (with an optional password, which is a good idea if you’re fairly mobile).

Preferences

Plus, you’ll also want to decide whether you want Notification Center integration or have Growl work independently. My preference is integrated, but YMMV.

The gntp-send app should build without issues. I did it via source download / configure / make / make install on a recent-ish Ubuntu box.

Then it’s just a matter of sourcing a version of this function. You’ll most likely wish to make more of the items defaults. Window users will need to tweak this a bit to work, but I’m betting most RStudio Server instances are running on Linux variants. I have it automatically setting the title and including which RStudio Server host the notice came from.

notify.gntp <- function(message, server, port=23053) {
  system(sprintf("/usr/local/bin/gntp-send -a 'RStudio Server' -s %s:%s '[running on %s]' '%s'",
                 server, port, as.character(Sys.info()["nodename"]), message),
         ignore.stdout=TRUE, ignore.stderr=TRUE, wait=FALSE)
}
 
# test it out 
WORKSTATION_RUNNING_GROWL = "10.0.1.5"
notify.gntp("ddply() finished", WORKSTATION_RUNNING_GROWL)

Banners_and_Alerts

You are going to need to do some additional work/coding if your IP address(es) change. I was going to hack something together that parses netstat output to make a guess at which node was the originating OS X system, but it should be quick enough to change out what your client IP address is, especially since this hack is intended for long-running jobs.

It’d be #spiffy if RStudio Server supported the browser notifications API and/or access to http header info from within the R session to make hacks like this easier or not necessary.

Thanks to a comment, I tweaked the data retrieval to ignore SSL cert errors. You can change that tweak back if you go through the pain of updating the SSL libraries on your Windows boxes (it doesn’t seem to be an issue on OS X/Linux).

I also changed the date routines to use as.POSIXlt instead of ISOdatetime as the latter seemed to cause issues for some folks.

All changes have been pushed to the github repo.

2013-09-16 UPDATE: I took suggestions from a couple comments, expanded the function a bit and stuck it in a gist. See this comment for details.

The data retrieval and computation operations are taking longer and longer as we start cranking through more security data and I’ll often let tasks run in the background whilst performing more mundane tasks or wasting time on Twitter. For folks using RStudio Desktop on a Mac, you can use the #spiffy terminal-notifier from Julien Blanchard (@julienXX) wrapped in a cozy little R function to alert you when your long-running jobs are complete.

After a quick “gem install terminal-notifier” you just need to add this notify() function to your R repertoire:

notify <- function(message="Operation complete") {
  system(sprintf("/usr/bin/terminal-notifier -title 'RStudio' -message '%s' -sender org.rstudio.RStudio -activate org.rstudio.RStudio",
                 message),
         ignore.stdout=TRUE, ignore.stderr=TRUE, wait=FALSE)
}

and add a call to it right after a potentially long-running operation to get a clickable notification right in the Notification Center:

system("sleep 10")
notify("long computation complete")

Banners_and_Alerts

I’m working on a way to send notifications from RStudio Server when using one of the standalone clients mentioned in a previous post, so stay tuned if you need that functionality as well.

It doesn’t get much better for me than when I can combine R and weather data in new ways. I’ve got something brewing with my Nest thermostat and needed to get some current wx readings plus forecast data. I could have chosen a number of different sources or API’s but I wanted to play with the data over at forecast.io (if you haven’t loaded their free weather “app” on your phone/tablet you should do that NOW) so I whipped together a small R package to fetch and process the JSON to make it easier to work with in R.

The package contains a singular function and the magic is all in the conversion of the JSON hourly/minutely weather data into R data frames, which is dirt simple to do since RJSONIO and sapply do all the hard work for us:

# take the JSON blob we got from forecast.io and make an R list from it
fio <- fromJSON(fio.json)
 
# extract hourly forecast data  
fio.hourly.df <- data.frame(
  time = ISOdatetime(1960,1,1,0,0,0) + sapply(fio$hourly$data,"[[","time"),
  summary = sapply(fio$hourly$data,"[[","summary"),
  icon = sapply(fio$hourly$data,"[[","icon"),
  precipIntensity = sapply(fio$hourly$data,"[[","precipIntensity"),
  temperature = sapply(fio$hourly$data,"[[","temperature"),
  apparentTemperature = sapply(fio$hourly$data,"[[","apparentTemperature"),
  dewPoint = sapply(fio$hourly$data,"[[","dewPoint"),
  windSpeed = sapply(fio$hourly$data,"[[","windSpeed"),
  windBearing = sapply(fio$hourly$data,"[[","windBearing"),
  cloudCover = sapply(fio$hourly$data,"[[","cloudCover"),
  humidity = sapply(fio$hourly$data,"[[","humidity"),
  pressure = sapply(fio$hourly$data,"[[","pressure"),
  visibility = sapply(fio$hourly$data,"[[","visibility"),
  ozone = sapply(fio$hourly$data,"[[","ozone")
)

You can view the full code over at github and there’s some sample usage below.

library("devtools")
install_github("Rforecastio", "hrbrmstr")
 
library(Rforecastio)
library(ggplot2)
 
# NEVER put credentials or api keys in script bodies or github repos!!
# the "config" file has one thing in it, the api key string on one line
# this is all it takes to read it in
fio.api.key = readLines("~/.forecast.io")
 
my.latitude = "43.2673"
my.longitude = "-70.8618"
 
fio.list <- fio.forecast(fio.api.key, my.latitude, my.longitude)
 
# setup "forecast" highlight plot area
 
forecast.x.min <- ISOdatetime(1960,1,1,0,0,0) + unclass(Sys.time())
forecast.x.max <- max(fio.list$hourly.df$time)
if (forecast.x.min > forecast.x.max) forecast.x.min <- forecast.x.max
fio.forecast.range.df <- data.frame(xmin=forecast.x.min, xmax=forecast.x.max,
                                    ymin=-Inf, ymax=+Inf)
 
# plot the readings
 
fio.gg <- ggplot(data=fio.list$hourly.df,aes(x=time, y=temperature))
fio.gg <- fio.gg + labs(y="Readings", x="Time")
fio.gg <- fio.gg + geom_rect(data=fio.forecast.range.df,
                             aes(xmin=xmin, xmax=xmax,
                                 ymin=ymin, ymax=ymax), 
                             fill="yellow", alpha=(0.15),
                             inherit.aes = FALSE)
fio.gg <- fio.gg + geom_line(aes(y=humidity*100), color="green")
fio.gg <- fio.gg + geom_line(aes(y=temperature), color="red")
fio.gg <- fio.gg + geom_line(aes(y=dewPoint), color="blue")
fio.gg <- fio.gg + theme_bw()
fio.gg

test

I’ve had a Nest thermometer for a while now and it’s been an overall positive experience. It’s given me more visibility into our heating/cooling system usage, patterns and preferences; plus, it actually saved us money last winter.

We try to avoid running the A/C during the summer, and it would have been really helpful if Nest had supported notifications (or had a proper API) for events such as “A/C turned on/off” for the few times it kicked in when we were away and had left the windows open (yes, we could have made “away” mode a bit less susceptible to big temperature swings). So, I decided to whip up a notification system and data logger using Scott Baker’s pynest library (and a little help from redis, mongo and pushover.net).

If you have a Nest thermometer, have an always on Linux box (this script should work nicely on a RaspberryPi) and want this functionality,

  • grab the code over at github
  • create a Pushover app so you can point the API interface there
  • install and start mongo and redis (both are very easy to setup)
  • create the config file
  • tell the script where to find the config file
  • setup a cron job. Every 5 mins shld work nicely:
    */5 * * * * /opt/nest/nizdos.py

Mongo is used for storing the readings (temp and humidity, for the moment; you can change the code to log whatever you want, tho) since it sends nice JSON to D3 without having to whip it into shape.

Redis is used for storing and updating the last known state of the heat/AC system. Technically you could use mongo or a flat file or memcached or sqlite or MySQL (you get the idea) for that, but I have redis running for other things and it’s just far too easy to setup and use.

Pushover is used for iOS and Android notifications (I really hope they add OS X soon :-)

Once @jayjacobs & I are done with our book in November, I’ll be doing another post and adding some code to the github repo to show how to do data analysis and visualization on all this data you’re logging.

If you’re wondering where the name nizdos came from and haven’t googled it yet, it’s an ancient Indo-European word for nest.

Drop me a note here or on github if you use the script (pls)! Send me a pull request on github if you fork the code make any cool changes. Definitely leave a bug report on github if you find any glaring errors.

For those who want the alerting without the overhead of actually dealing with this script, drop me tweet (@hrbrmstr). I’m pretty close to just having the alerting function working in Google’s AppEngine, which won’t require much setup for those without the infrastructure or time to use this script.

alogoWhile you can (and should) view [all the presentations](https://speakerdeck.com/pyconslides) from #PyCon2013, here are my picks for the ones that interested me the most, as they focus on scaling, mapping, automation (both web & electronics) and data analysis:

– [Chef: Why you should automate your web infrastructure](https://speakerdeck.com/pyconslides/chef-why-you-should-automate-your-web-infrastructure-by-kate-heddleston) by Kate Heddleston
– [Messaging at Scale at Instagram](https://speakerdeck.com/pyconslides/messaging-at-scale-at-instagram-by-rick-branson) by Rick Branson
– [Python at Netflix](https://speakerdeck.com/pyconslides/python-at-netflix-by-jeremy-edberg-corey-bertram-and-roy-rapoport) by Jeremy Edberg, Corey Bertram, and Roy Rapoport
– [Real-time Tracking and Mapping of Geographic Objects](https://speakerdeck.com/pyconslides/real-time-tracking-and-mapping-of-geographic-objects-by-ragi-burhum) by Ragi Burhum
– [Scaling Realtime at DISQUS](https://speakerdeck.com/pyconslides/scaling-realtime-at-disqus-by-adam-hitchcock) by Adam Hitchcock
– [A Crash Course in MongoDB](https://speakerdeck.com/pyconslides/a-crash-course-in-mongodb)
– [Server Log Analysis with Pandas](https://speakerdeck.com/pyconslides/server-log-analysis-with-pandas-by-taavi-burns) by Taavi Burns
– [Who’s There – Home Automation with Arduino and RaspberryPi](https://speakerdeck.com/pyconslides/whos-there-home-automation-with-arduino-and-raspberrypi-by-rupa-dachere) by Rupa Dachere
x
– [Why you should use Python 3 for text processing](https://speakerdeck.com/pyconslides/why-you-should-use-python-3-for-text-processing-by-david-mertz) by David Mertz
– [Awesome Big Data Algorithms](https://speakerdeck.com/pyconslides/awesome-big-data-algorithms-by-titus-brown) by Titus Brown

A huge thanks to the speakers and conference organizers for making these resources freely available, especially to those of us who were not able to attend the conference.

This is part of a larger project I’m working on, but it’s useful enough to share (github version coming soon).

The fine folks at @TeamCymru have a great service to map IP addresses to ASN/BGP information en masse.

There are libraries for Python, Perl and other languages but none for R (that I could find). So, I threw together a quick set of functions to interface to @TeamCymru’s service. Unlike many other modern services, this one isn’t XML or JSON over a RESTful interface, so the code uses a socketConnection() over the standard WHOIS TCP port to post and retrieve simple text lists.

#
# bulkorigin.R - perform bulk IP to ASN mapping via Team Cymru whois service
#
# Author: @hrbrmstr
# Version: 0.1
# Date: 2013-02-07
#
# Copyright 2013 Bob Rudis
# 
# Permission is hereby granted, free of charge, to any person obtaining
# a copy of this software and associated documentation files (the
# "Software"), to deal in the Software without restriction, including
# without limitation the rights to use, copy, modify, merge, publish,
# distribute, sublicense, and/or sell copies of the Software, and to
# permit persons to whom the Software is furnished to do so, subject to
# the following conditions:
#   
# The above copyright notice and this permission notice shall be
# included in all copies or substantial portions of the Software.
# 
# THE SOFTWARE IS PROVIDED "AS IS", WITHOUT WARRANTY OF ANY KIND,
# EXPRESS OR IMPLIED, INCLUDING BUT NOT LIMITED TO THE WARRANTIES OF
# MERCHANTABILITY, FITNESS FOR A PARTICULAR PURPOSE AND
# NONINFRINGEMENT. IN NO EVENT SHALL THE AUTHORS OR COPYRIGHT HOLDERS BE
# LIABLE FOR ANY CLAIM, DAMAGES OR OTHER LIABILITY, WHETHER IN AN ACTION
# OF CONTRACT, TORT OR OTHERWISE, ARISING FROM, OUT OF OR IN CONNECTION
# WITH THE SOFTWARE OR THE USE OR OTHER DEALINGS IN THE SOFTWARE.#
 
library(plyr)
 
# short function to trim leading/trailing whitespace
trim <- function (x) gsub("^\\s+|\\s+$", "", x)
 
BulkOrigin <- function(ip.list,host="v4.whois.cymru.com",port=43) {
 
  # Retrieves BGP Origin ASN info for a list of IP addresses
  #
  # NOTE: IPv4 version
  #
  # NOTE: The Team Cymru's service is NOT a GeoIP service!
  # Do not use this function for that as your results will not
  # be accurate.
  #
  # Args:
  #   ip.list : character vector of IP addresses
  #   host: which server to hit for lookup (defaults to Team Cymru's server)
  #   post: TCP port to use (defaults to 43)
  #
  # Returns:
  #   data frame of BGP Origin ASN lookup results
 
 
  # setup query
  cmd = "begin\nverbose\n" 
  ips = paste(unlist(ip.list), collapse="\n")
  cmd = sprintf("%s%s\nend\n",cmd,ips)
 
  # setup connection and post query
  con = socketConnection(host=host,port=port,blocking=TRUE,open="r+")  
  cat(cmd,file=con)
  response = readLines(con)
  close(con)
 
  # trim header, split fields and convert results
  response = response[2:length(response)]
  response = lapply(response,function(n) {
    sapply(strsplit(n,"|",fixed=TRUE),trim)
  })  
  response = adply(response,c(1))
  response = response[,2:length(response)]
  names(response) = c("AS","IP","BGP.Prefix","CC","Registry","Allocated","AS.Name")
 
  return(response)
 
}
 
BulkPeer <- function(ip.list,host="v4-peer.whois.cymru.com",port=43) {
 
  # Retrieves BGP Peer ASN info for a list of IP addresses
  #
  # NOTE: IPv4 version
  #
  # NOTE: The Team Cymru's service is NOT a GeoIP service!
  # Do not use this function for that as your results will not
  # be accurate.
  #
  # Args:
  #   ip.list : character vector of IP addresses
  #   host: which server to hit for lookup (defaults to Team Cymru's server)
  #   post: TCP port to use (defaults to 43)
  #
  # Returns:
  #   data frame of BGP Peer ASN lookup results
 
 
  # setup query
  cmd = "begin\nverbose\n" 
  ips = paste(unlist(ip.list), collapse="\n")
  cmd = sprintf("%s%s\nend\n",cmd,ips)
 
  # setup connection and post query
  con = socketConnection(host=host,port=port,blocking=TRUE,open="r+")  
  cat(cmd,file=con)
  response = readLines(con)
  close(con)
 
  # trim header, split fields and convert results
  response = response[2:length(response)]
  response = lapply(response,function(n) {
    sapply(strsplit(n,"|",fixed=TRUE),trim)
  })  
  response = adply(response,c(1))
  response = response[,2:length(response)]
  names(response) = c("Peer.AS","IP","BGP.Prefix","CC","Registry","Allocated","Peer.AS.Name")
  return(response)
 
}

Take a list of IPs, make an IP connection, formulate a bulk query and convert the results. Here’s a small script to test it:

ips = c("100.43.81.11","100.43.81.7")
origin = BulkOrigin(ips)
str(origin)
peers = BulkPeer(ips)
str(peers)

That code outputs:

'data.frame':	2 obs. of  7 variables:
 $ AS        : chr  "13238" "13238"
 $ IP        : chr  "100.43.81.11" "100.43.81.7"
 $ BGP.Prefix: chr  "100.43.64.0/19" "100.43.64.0/19"
 $ CC        : chr  "US" "US"
 $ Registry  : chr  "arin" "arin"
 $ Allocated : chr  "2011-12-06" "2011-12-06"
 $ AS.Name   : chr  "YANDEX Yandex LLC" "YANDEX Yandex LLC"

and

'data.frame':	8 obs. of  7 variables:
 $ Peer.AS     : chr  "174" "3257" "9002" "10310" ...
 $ IP          : chr  "100.43.81.11" "100.43.81.11" "100.43.81.11" "100.43.81.11" ...
 $ BGP.Prefix  : chr  "100.43.64.0/19" "100.43.64.0/19" "100.43.64.0/19" "100.43.64.0/19" ...
 $ CC          : chr  "US" "US" "US" "US" ...
 $ Registry    : chr  "arin" "arin" "arin" "arin" ...
 $ Allocated   : chr  "2011-12-06" "2011-12-06" "2011-12-06" "2011-12-06" ...
 $ Peer.AS.Name: chr  "COGENT Cogent/PSI" "TINET-BACKBONE Tinet SpA" "RETN-AS ReTN.net Autonomous System" "YAHOO-1 - Yahoo!" ...

respectively for each str().

Nothing super-sexy, but it’s part of a mission I’m on to make IP addresses “first class citizens” in R. I’m starting with building some smaller functions that accumulate IP metadata and will ultimately collect them all into a compact R library.

In the interim, I thought these two routines might be useful to some folks.

With just these two functions, you can use various graphing libraries to get a picture of the network connectivity. Here’s a small sample to get you started:

library(igraph)
 
ips = c("100.43.81.11")
origin = BulkOrigin(ips)
peers = BulkPeer(ips)
 
g = graph.empty() + vertices(c(ips, peers$Peer.AS, origin$AS),size=30)
V(g)$label = c(ips, peers$Peer.AS, origin$AS)
e = lapply(peers$Peer.AS,function(x) {
  c(origin$AS,x)
})
g = g + edges(unlist(e))
g = g + edge(ips, origin$AS)
g$layout = layout.circle
plot(g)

asn

If you know of any other R libraries or code that provide functions that operate on IP addresses or interface to services that provide IP address metadata, please drop a note in the comments or ping me on Twitter.