Skip navigation

Category Archives: Commentary

I apologize up-front for using bad words in this post.

Said bad words include “Facebook”, “Mark Zuckerberg” and many referrals to entities within the U.S. Government. Given the topic, it cannot be helped.

I’ve also left the R tag on this despite only showing some ggplot2 plots and Markdown tables. See the end of the post for how to get access to the code & data. R was used solely and extensively for the work behind the words.


This week Congress put on a show as they summoned the current Facebook CEO — Mark Zuckerberg — down to Washington, D.C. to demonstrate how little most of them know about how the modern internet and social networks actually work plus chest-thump to prove to their constituents they really and truly care about you.

These Congress-critters offered such proof in the guise of railing against Facebook for how they’ve handled your data. Note that I should really say our data since they do have an extensive profile database on me and most everyone else even if they’re not Facebook platform users (full disclosure: I do not have a Facebook account).

Ostensibly, this data-mishandling impacted your privacy. Most of the committee members wanted any constituent viewers to come away believing they and their fellow Congress-critters truly care about your privacy.

Fortunately, we have a few ways to measure this “caring” and the remainder of this post will explore how much members of the U.S. House and Senate care about your privacy when you visit their official .gov web sites. Future posts may explore campaign web sites and other metrics, but what better place to show they care about you then right there in their digital houses.

Privacy Primer

When you visit a web site with any browser, the main URL pulls in resources to aid in the composition and functionality of the page. These could be:

  • HTML (the main page is very likely HTML unless it’s just a media URL)
  • images (png, jpg, gif, “svg”, etc),
  • fonts
  • CSS (the “style sheet” that tells the browser how to decorate and position elements on the page)
  • binary objects (such as embedded PDF files or “protocol buffer” content)
  • XML or JSON
  • JavaScript

(plus some others)

When you go to, say, www.example.com the site does not have to load all the resources from example.com domains. In fact, it’s rare to find a modern site which does not use resources from one or more third party sites.

When each resource is loaded (generally) some information about you goes along for the ride. At a minimum, the request time and source (your) IP address is exposed and — unless you’re really careful/paranoid — the referring site, browser configuration and even cookies are even available to the third party sites. It does not take many of these data points to (pretty much) uniquely identify you. And, this is just for “benign” content like images. We’ll get to JavaScript in a bit.

As you move along the web, these third-party touch-points add up. To demonstrate this, I did my best to de-privatize my browser and OS configuration and visited 12 web sites while keeping a fresh install of Firefox Lightbeam running. Here’s the result:

Each main circle is a distinct/main site and the triangles are resources the site tried to load. The red triangles indicate a common third-party resource that was loaded by two or more sites. Each of those red triangles knows where you’ve been (again, unless you’ve been very careful/paranoid) and can use that information to enhance their knowledge about you.

It gets a bit worse with JavaScript content since a much stronger fingerprint can be created for you (you can learn more about fingerprints at this spiffy EFF site). Plus, JavaScript code can try to pilfer cookies, “hack” the browser, serve up malicious adverts, measure time-on-site, and even enlist you in a cryptomining army.

There are other issues with trusting loaded browser content, but we’ll cover that a bit further into the investigation.

Measuring “Caring”

The word “privacy” was used over 100 times each day by both Zuckerberg and our Congress-critters. Senators and House members made it pretty clear Facebook should care more about your privacy. Implicit in said posit is that they, themselves, must care about your privacy. I’m sure they’ll be glad to point out all along the midterm campaign trails just how much they’re doing to protect your privacy.

We don’t just have to take their word for it. After berating Facebook’s chief college dropout and chastising the largest social network on the planet we can see just how much of “you” these representatives give to Facebook (and other sites) and also how much they protect you when you decide to pay them[] [] a digital visit.

For this metrics experiment, I built a crawler using R and my splashr? package which, in turn, uses ScrapingHub’s open source Splash. Splash is an automation framework that lets you programmatically visit a site just like a human would with a real browser.

Normally when one scrapes content from the internet they’re just grabbing the plain, single HTML file that is at the target of a URL. Splash lets us behave like a browser and capture all the resources — images, CSS, fonts, JavaScript — the site loads and will also execute any JavaScript, so it will also capture resources each script may itself load.

By capturing the entire browser experience for the main page of each member of Congress we can get a pretty good idea of just how much each one cares about your digital privacy, and just how much they secretly love Facebook.

Let’s take a look, first, at where you go when you digitally visit a Congress-critter.

Network/Hosting/DNS

Each House and Senate member has an official (not campaign) site that is hosted on a .gov domain and served up from a handful of IP addresses across the following (n is the number of Congress-critter web sites):

asn aso n
AS5511 Orange 425
AS7016 Comcast Cable Communications, LLC 95
AS20940 Akamai International B.V. 13
AS1999 U.S. House of Representatives 6
AS7843 Time Warner Cable Internet LLC 1
AS16625 Akamai Technologies, Inc. 1

“Orange” is really Akamai and Akamai is a giant content delivery network which helps web sites efficiently provide content to your browser and can offer Denial of Service (DoS) protection. Most sites are behind Akamai, which means you “touch” Akamai every time you visit the site. They know you were there, but I know a sufficient body of folks who work at Akamai and I’m fairly certain they’re not too evil. Virtually no representative solely uses House/Senate infrastructure, but this is almost a necessity given how easy it is to take down a site with a DoS attack and how polarized politics is in America.

To get to those IP addresses, DNS names like www.king.senate.gov (one of the Senators from my state) needs to be translated to IP addresses. DNS queries are also data gold mines and everyone from your ISP to the DNS server that knows the name-to-IP mapping likely sees your IP address. Here are the DNS servers that serve up the directory lookups for all of the House and Senate domains:

nameserver gov_hosted
e4776.g.akamaiedge.net. FALSE
wc.house.gov.edgekey.net. FALSE
e509.b.akamaiedge.net. FALSE
evsan2.senate.gov.edgekey.net. FALSE
e485.b.akamaiedge.net. FALSE
evsan1.senate.gov.edgekey.net. FALSE
e483.g.akamaiedge.net. FALSE
evsan3.senate.gov.edgekey.net. FALSE
wwwhdv1.house.gov. TRUE
firesideweb02cc.house.gov. TRUE
firesideweb01cc.house.gov. TRUE
firesideweb03cc.house.gov. TRUE
dchouse01cc.house.gov. TRUE
c3pocc.house.gov. TRUE
ceweb.house.gov. TRUE
wwwd2-cdn.house.gov. TRUE
45press.house.gov. TRUE
gopweb1a.house.gov. TRUE
eleven11web.house.gov. TRUE
frontierweb.house.gov. TRUE
primitivesocialweb.house.gov. TRUE

Akamai kinda does need to serve up DNS for the sites they host, so this list also makes sense. But, you’ve now had two touch-points logged and we haven’t even loaded a single web page yet.

Safe? & Secure? Connections

When we finally make a connection to a Congress-critter’s site, it is going to be over SSL/TLS. They all support it (which is ?, but SSL/TLS confidentiality is not as bullet-proof as many “HTTPS Everywhere” proponents would like to con you into believing). However, I took a look at the SSL certificates for House and Senate sites. Here’s a sampling from, again, my state (one House representative):

The *.house.gov “Common Name (CN)” is a wildcard certificate. Many SSL certificates have just one valid CN, but it’s also possible to list alternate, valid “alt” names that can all use the same, single certificate. Wildcard certificates ease the burden of administration but it also means that if, say, I managed to get my hands on the certificate chain and private key file, I could setup vladimirputin.house.gov somewhere and your browser would think it’s A-OK. Granted, there are far more Representatives than there are Senators and their tenure length is pretty erratic these days, so I can sort of forgive them for taking the easy route, but I also in no way, shape or form believe they protect those chains and private keys well.

In contrast, the Senate can and does embed the alt-names:

Are We There Yet?

We’ve got the IP address of the site and established a “secure” connection. Now it’s time to grab the index page and all the rest of the resources that come along for the ride. As noted in the Privacy Primer (above), the loading of third-party resources is problematic from a privacy (and security) perspective. Just how many third party resources do House and Senate member sites rely on?

To figure that out, I tallied up all of the non-.gov resources loaded by each web site and plotted the distribution of House and Senate (separately) in a “beeswarm” plot with a boxplot shadowing underneath so you can make out the pertinent quantiles:

As noted, the median is around 30 for both House and Senate member sites. In other words, they value your browsing privacy so little that most Congress-critters gladly share your browser session with many other sites.

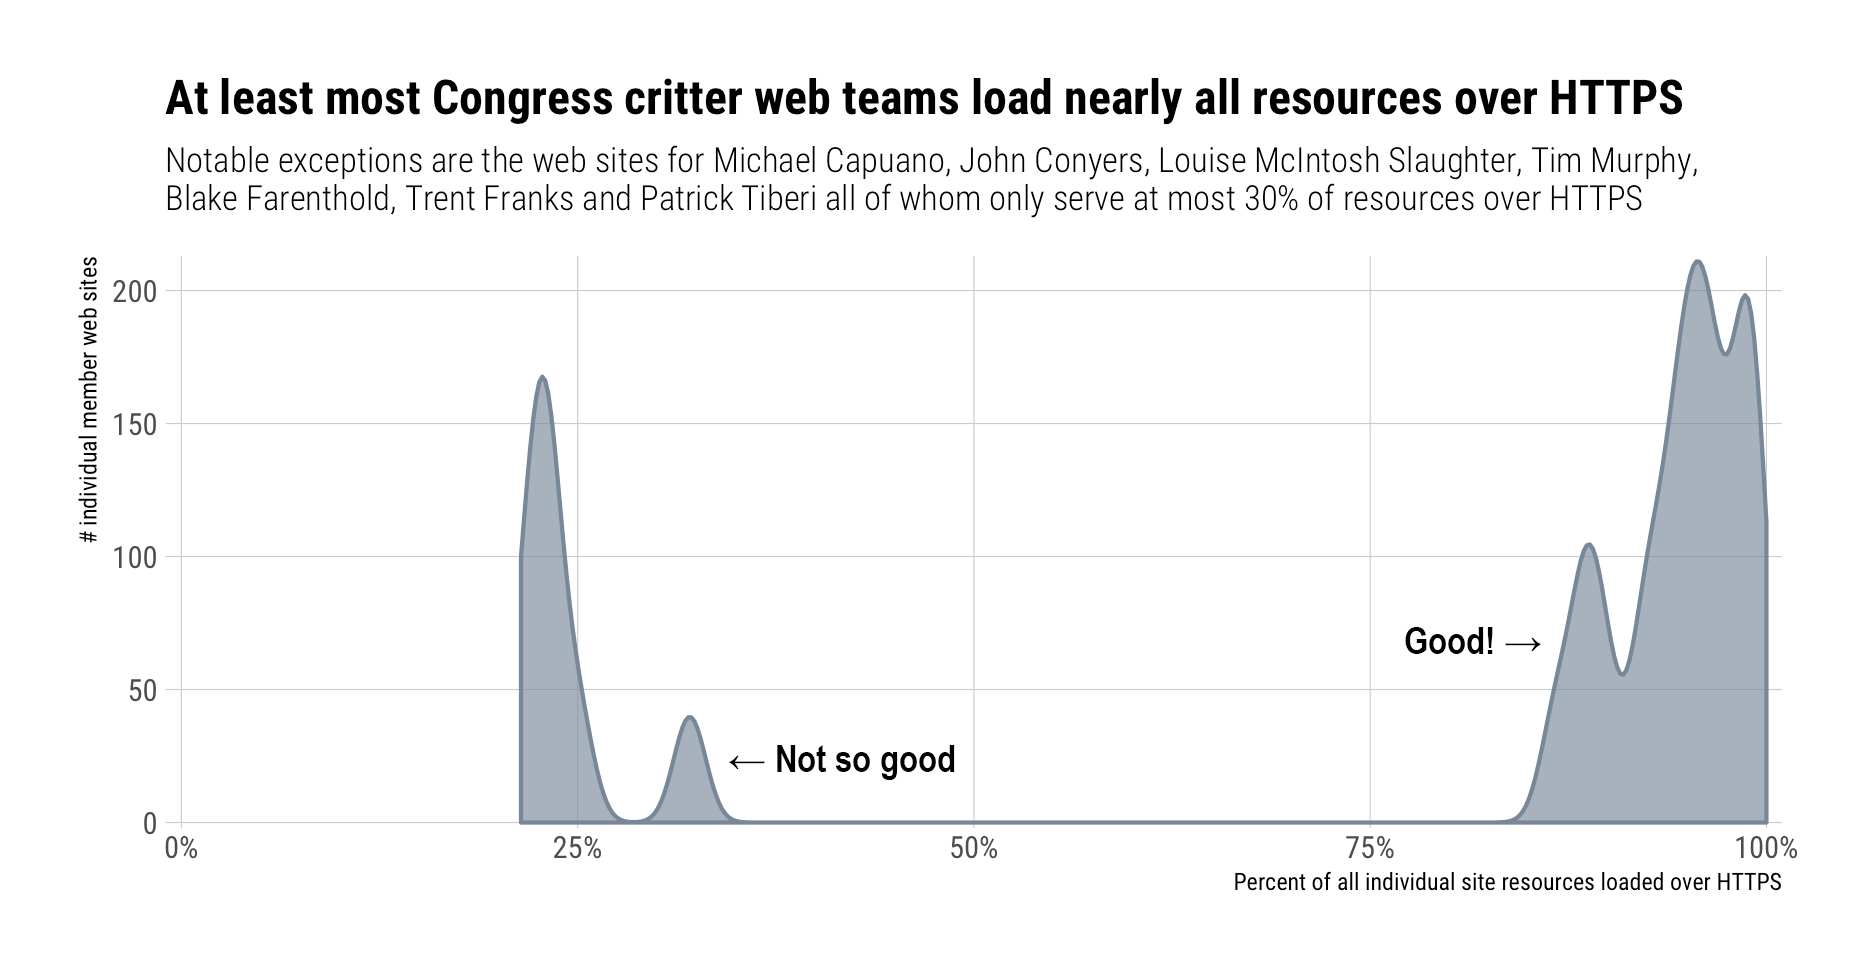
We also talked about confidentiality above. If an https site loads http resources the contents of what you see on the page cannot but guaranteed. So, how responsible are they when it comes to at least ensuring these third-party resources are loaded over https?

You’re mostly covered from a pseudo-confidentiality perspective, but what are they serving up to you? Here’s a summary of the MIME types being delivered to you:

MIME Type Number of Resources Loaded
image/jpeg 6,445
image/png 3,512
text/html 2,850
text/css 1,830
image/gif 1,518
text/javascript 1,512
font/ttf 1,266
video/mp4 974
application/json 673
application/javascript 670
application/x-javascript 353
application/octet-stream 187
application/font-woff2 99
image/bmp 44
image/svg+xml 39
text/plain 33
application/xml 15
image/jpeg, video/mp2t 12
application/x-protobuf 9
binary/octet-stream 5
font/woff 4
image/jpg 4
application/font-woff 2
application/vnd.google.gdata.error+xml 1

We’ll cover some of these in more detail a bit further into the post.

Facebook & “Friends”

Facebook started all this, so just how cozy are these Congress-critters with Facebook?

Turns out that both Senators and House members are very comfortable letting you give Facebook a love-tap when you come visit their sites since over 60% of House and 40% of Senate sites use 2 or more Facebook resources. Not all Facebook resources are created equal[ly evil] and we’ll look at some of the more invasive ones soon.

Facebook is not the only devil out there. I added in the public filter list from Disconnect and the numbers go up from 60% to 70% for the House and from 40% to 60% for the Senate when it comes to a larger corpus of known tracking sites/resources.

Here’s a list of some (first 20) of the top domains (with one of Twitter’s media-serving domains taking the individual top-spot):

Main third-party domain # of ‘pings’ %
twimg.com 764 13.7%
fbcdn.net 655 11.8%
twitter.com 573 10.3%
google-analytics.com 489 8.8%
doubleclick.net 462 8.3%
facebook.com 451 8.1%
gstatic.com 385 6.9%
fonts.googleapis.com 270 4.9%
youtube.com 246 4.4%
google.com 183 3.3%
maps.googleapis.com 144 2.6%
webtrendslive.com 95 1.7%
instagram.com 75 1.3%
bootstrapcdn.com 68 1.2%
cdninstagram.com 63 1.1%
fonts.net 51 0.9%
ajax.googleapis.com 50 0.9%
staticflickr.com 34 0.6%
translate.googleapis.com 34 0.6%
sharethis.com 32 0.6%

So, when you go to check out what your representative is ‘officially’ up to, you’re being served…up on a silver platter to a plethora of sites where you are the product.

It’s starting to look like Congress-folk aren’t as sincere about your privacy as they may have led us all to believe this week.

A [Java]Script for Success[ful Privacy Destruction]

As stated earlier, not all third-party content is created equally malicious. JavaScript resources run code in your browser on your device and while there are limits to what it can do, those limits diminish weekly as crafty coders figure out more ways to use JavaScript to collect information and perform shady or malicious deeds.

So, how many House/Senate sites load one or more third-party JavaScript resources?

Virtually all of them.

To make matters worse, no .gov or third-party resource of any kind was loaded using subresource integrity validation. Subresource integrity validation means that the site owner — at some point — ensured that the resource being loaded was not malicious and then created a fingerprint for it and told your browser what that fingerprint is so it can compare it to what got loaded. If the fingerprints don’t match, the content is not loaded/executed. Using subresource integrity is not trivial since it requires a top-notch content management team and failure to synchronize/checkpoint third-party content fingerprints will result in resources failing to load.

Congress was quick to demand that Facebook implement stronger policies and controls, but they, themselves, cannot be bothered.

Future Work

There are plenty more avenues to explore in this data set (such as “security headers” — they all 100% use strict-transport-security pretty well, but are deeply deficient in others) and more targets for future works, such as the campaign sites of House and Senate members. I may follow up with a look at a specific slice from this data set (the members of the committees who were berating Zuckerberg this week).

The bottom line is that while the beating Facebook took this week was just, those inflicting the pain have a long way to go themselves before they can truly judge what other social media and general internet sites do when it comes to ensuring the safety and privacy of their visitors.

In other words, “Legislator, regulate thyself” before thy regulatists others.

FIN

Apart from some egregiously bad (or benign) examples, I tried not to “name and shame”. I also won’t answer any questions about facets by party since that really doesn’t matter too much as they’re all pretty bad when it comes to understanding and implementing privacy and safey on their sites.

The data set can be found over at Zenodo (alternately, click/tap/select the badge below). I converted the R data frame to ndjson/streaming JSON/jsonlines (however you refer to the format) and tested it out in Apache Drill.

I’ll toss up some R code using data extracts later this week (meaning by April 20th).

DOI

NOTE: If the usual aggregators are picking this up and there are humans curating said aggregators, this post is/was not intended as something to go into the “data science” aggregation sites. Just personal commentary with code in the event someone stumbles across it and wanted to double check me. These “data-dives” help me cope with these type of horrible events.

The “data science” feed URL is https://rud.is/b/category/r/feed/.

I saw the story about body camera footage from a officers involved police stop & fatal shooting in Salt Lake City.
The indiviual killed was a felon — convicted of aggravated assuault — with an outstanding warrant.

He tried to run. At some point in the brief chase he pivoted and appeared to be reaching for a weapon — likely a knife, which was confirmed after the fact.

One officer pulled a tazer. Another pulled a gun. Officer Fox — the one who fired the gun — said he was terrified by how close Mr. Harmon was to the officers when Mr. Harmon stopped and turned toward them.

I wasn’t there. I don’t risk getting injured or killed in the line of duty every day. I don’t face down armed suspects in fast-moving, tense situations.

But, I’m weary of this being a cut+paste story that is a nigh weekly event in America.

Officers are killed by suspects as well. It’s equally tragic.

Below is just “data”. Just a visual documentary of where we are 17-ish years into the 21st Century in America.

And, most of America seems to be OK with this. Then again, most of America is OK with the “price of freedom” being one mass shooting a day.

I’m not.

I scaled the Y axis the same in both faceted charts to make it easier to glance across both sets of tragedies.

This was generated on Sunday, October 8, 2017. If you run the code after that date, remove the saved data files and tweak the Y-scale limits since the death toll will rise.

library(httr)
library(rvest)
library(stringi)
library(hrbrthemes)
library(tidyverse)

read.table(sep=":", stringsAsFactors=FALSE, header=TRUE, 
           text="race:description
W:White, non-Hispanic
B:Black, non-Hispanic
H:Hispanic
N:Native American
A:Asian
None:Other/Unknown
O:Other") -> rdf

wapo_data_url <- "https://raw.githubusercontent.com/washingtonpost/data-police-shootings/master/fatal-police-shootings-data.csv"
shootings_file <- basename(wapo_data_url)
if (!file.exists(shootings_file)) download.file(wapo_data_url, shootings_file)

cols(
  id = col_integer(),
  name = col_character(),
  date = col_date(format = ""),
  manner_of_death = col_character(),
  armed = col_character(),
  age = col_integer(),
  gender = col_character(),
  race = col_character(),
  city = col_character(),
  state = col_character(),
  signs_of_mental_illness = col_character(),
  threat_level = col_character(),
  flee = col_character(),
  body_camera = col_character()
) -> shootings_cols

read_csv(shootings_file, col_types = shootings_cols) %>% 
  mutate(yr = lubridate::year(date), wk = lubridate::week(date)) %>% 
  filter(yr >= 2017) %>% 
  mutate(race = ifelse(is.na(race), "None", race)) %>% 
  mutate(race = ifelse(race=="O", "None", race)) %>% 
  count(race, wk) %>% 
  left_join(rdf, by="race") %>% 
  mutate(description = factor(description, levels=rdf$description)) -> xdf

lod_url <- "https://www.odmp.org/search/year/2017?ref=sidebar"
lod_rds <- "officer_lod.rds"
if (!file.exists(lod_rds)) {
  res <- httr::GET(lod_url)
  write_rds(res, lod_rds)
} else {
  res <- read_rds(lod_rds)
}
pg <- httr::content(res, as="parsed", encoding = "UTF-8")

html_nodes(pg, xpath=".//table[contains(., 'Detective Chad William Parque')]") %>% 
  html_nodes(xpath=".//td[contains(., 'EOW')]") %>% 
  html_text() %>% 
  stri_extract_all_regex("(EOW:[[:space:]]+(.*)\n|Cause of Death:[[:space:]]+(.*)\n)", simplify = TRUE) %>% 
  as_data_frame() %>% 
  mutate_all(~{
    stri_replace_first_regex(.x, "^[[:alpha:][:space:]]+: ", "") %>% 
      stri_trim_both() 
    }
  ) %>% 
  as_data_frame() %>%  
  set_names(c("day", "cause")) %>% 
  mutate(day = as.Date(day, "%A, %B %e, %Y"), wk = lubridate::week(day))%>% 
  count(wk, cause) -> odf 

ggplot(xdf, aes(wk, n)) +
  geom_segment(aes(xend=wk, yend=0)) +
  scale_y_comma(limits=c(0,15)) +
  facet_wrap(~description, scales="free_x") +
  labs(x="2017 Week #", y="# Deaths",
       title="Weekly Fatal Police Shootings in 2017",
       subtitle=sprintf("2017 total: %s", scales::comma(sum(xdf$n))),
       caption="Source: https://www.washingtonpost.com/graphics/national/police-shootings-2017/") +
  theme_ipsum_rc(grid="Y")

count(odf, cause, wt=n, sort=TRUE) -> ordr

mutate(odf, cause = factor(cause, levels=ordr$cause)) %>% 
  ggplot(aes(wk, n)) +
  geom_segment(aes(xend=wk, yend=0)) +
  scale_x_continuous(limits=c(0, 40)) +
  scale_y_comma(limits=c(0,15)) +
  facet_wrap(~cause, ncol=3, scales="free_x") +
  labs(x="2017 Week #", y="# Deaths",
       title="Weekly Officer Line of Duty Deaths in 2017",
       subtitle=sprintf("2017 total: %s", scales::comma(sum(odf$n))),
       caption="Source: https://www.odmp.org/search/year/2017") +
  theme_ipsum_rc(grid="Y")

I need to be up-front about something: I’m somewhat partially at fault for ? being elected. While I did not vote for him, I could not in any good conscience vote for his Democratic rival. I wrote in a ticket that had one Democrat and one Republican on it. The “who” doesn’t matter and my district in Maine went abundantly for ?’s opponent, so there was no real impact of my direct choice but I did actively point out the massive flaws in his opponent. Said flaws were many and I believe we’d be in a different bad place, but not equally as bad of a place now with her. But, that’s in the past and we’ve got a new reality to deal with, now.

This is a (hopefully) brief post about finding a way out of this mess we’re in. It’s far from comprehensive, but there’s honest-to-goodness evil afoot that needs to be met head on.

Brand Damage

You’ll note I’m not using either of their names. Branding is extremely important to both of them, but is the almost singular focus of ?. His name is his hotel brand, company brand and global identifier. Using it continues to add it to the history books and can only help inflate the power of that brand. First and foremost, do not use his name in public posts, articles, papers, etc. “POTUS”, “The President”, “The Commander in Chief”, “?” (chosen to match his skin/hair color, complexion and that comb-over tuft) are all sufficient references since there is date-context with virtually anything we post these days. Don’t help build up his brand. Don’t populate historical repositories with his name. Don’t give him what he wants most of all: attention.

Document and Defend with Data

Speaking of the historical record, we need to be blogging and publishing regularly the actual facts based on data. We also need to save data as there’s signs of a deliberate government purge going on. I’m not sure how successful said purge will be in the long run and I suspect that the long-term effects of data purging and corruption by this administration will have lasting unintended consequences.

Join/support @datarefuge to save data & preserve the historical record.

Install the Wayback Machine plugin and take the 2 seconds per site you visit to click it.

Create blog posts, tweets, news articles and papers that counter bad facts with good/accurate/honest ones. Don’t make stuff up (even a little). Validate your posits before publishing. Write said posts in a respectful tone.

Support the Media

When the POTUS’ Chief Strategist says things like “The media should be embarrassed and humiliated and keep its mouth shut and just listen for a while” it’s a deliberate attempt to curtail the Press and eventually there will be more actions to actually suppress Press freedom.

I’m not a liberal (I probably have no convenient definition) and I think the Press gave Obama a free ride during his eight year rule. They are definitely making up for that now, mostly because their very livelihoods are at stake.

The problem with them is that they are continuing to let themselves be manipulated by ?. He’s a master at this manipulation. Creating a story about the size of his hands in a picture delegitimizes you as a purveyor of news, especially when — as you’re watching his hands — he’s separating families, normalizing bigotry and undermining the Constitution. Forget about the hands and even forget about the hotels (for now). There was even a recent story trying to compare email servers (the comparison is very flawed). Stop it.

Encourage reporters to focus on things that actually matter and provide pointers to verifiable data they can use to call out the lack of veracity in ?’s policies. Personal blog posts are fleeting things but an NYT, WSJ (etc) story will live on.

Be Kind

I’ve heard and read some terrible language about rural America from what I can only classify as “liberals” in the week this post was written. Intellectual hubris and actual, visceral disdain for those who don’t think a certain way were two major reasons why ? got elected. The actual reasons he got elected are diverse and very nuanced.

Regardless of political leaning, pick your head up from your glowing rectangles and go out of your way to regularly talk to someone who doesn’t look, dress, think, eat, etc like you. Engage everyone with compassion. Regularly challenge your own beliefs.

There is a wedge that I estimate is about 1/8th of the way into the core of America now. Perpetuating this ideological “us vs them” mindset is only going to fuel the fires that created the conditions we’re in now and drive the wedge in further. The only way out is through compassion.

Remember: all life matters. Your degree, profession, bank balance or faith alignment doesn’t give you the right to believe you are better than anyone else.

FIN (for now)

I’ll probably move most of future opines to a new medium (not uppercase Medium) as you may be getting this drivel when you want recipes or R code (even though there are separate feeds for them).

UPDATE: I’m glad I’m not the only one who was skeptical of this project: http://andrewgelman.com/2017/01/02/constructing-expert-indices-measuring-electoral-integrity-reply-pippa-norris/

When I saw the bombastic headline “North Carolina is no longer classified as a democracy” pop up in my RSS feeds today (article link: http://www.newsobserver.com/opinion/op-ed/article122593759.html) I knew it’d help feed polarization bear that’s been getting fat on ‘Murica for the past decade. Sure enough, others picked it up and ran with it. I can’t wait to see how the opposite extreme reacts (everybody’s gotta feed the bear).

As of this post, neither site linked to the actual data, so here’s an early Christmas present: The Electoral Integrity Project Data. I’m very happy this is public data since this is the new reality for “news” intake:

  • Read shocking headline
  • See no data, bad data, cherry-picked data or poorly-analyzed data
  • Look for the actual data
  • Validate data & findings
  • Possibly learn even more from the data that was deliberately left out or ignored

Data literacy is even more important than it has been.

Back to the title of the post: where exactly does North Carolina fall on the newly assessed electoral integrity spectrum in the U.S.? Right here (click to zoom in):

Focusing solely on North Carolina is pretty convenient (I know there’s quite a bit of political turmoil going on down there at the moment, but that’s no excuse for cherry picking) since — frankly — there isn’t much to be proud of on that entire chart. Here’s where the ‘States fit on the global rankings (we’re in the gray box):

You can page through the table to see where our ‘States fall (we’re between Guana & Latvia…srsly). We don’t always have the nicest neighbors:

This post isn’t a commentary on North Carolina, it’s a cautionary note to be very wary of scary headlines that talk about data but don’t really show it. It’s worth pointing out that I’m taking the PEI data as it stands. I haven’t validated the efficacy of their process or checked on how “activist-y” the researchers are outside the report. It’s somewhat sad that this is a necessary next step since there’s going to be quite a bit of lying with data and even more lying about-and/or-without data over the next 4+ years on both sides (more than in the past eight combined, probably).

The PEI folks provide methodology information and data. Read/study it. They provide raw and imputed confidence intervals (note how large some of those are in the two graphs) – do the same for your research. If their practices are sound, the ‘States chart is pretty damning. I would hope that all the U.S. states would be well above 75 on the rating scale and the fact that we aren’t is a suggestion that we all have work to do right “here” at home, beginning with ceasing to feed the polarization bear.

If you do download the data, here’s the R code that generated the charts:

library(tidyverse)

# u.s. ------------------------------------------------------------------------------

eip_state <- read_tsv("~/Data/eip_dataverse_files/PEI US 2016 state-level (PEI_US_1.0) 16-12-2018.tab")

arrange(eip_state, PEIIndexi) %>%
  mutate(state=factor(state, levels=state)) -> eip_state

ggplot() +
  geom_linerange(data=eip_state, aes(state, ymin=PEIIndexi_lci, ymax=PEIIndexi_hci), size=0.25, color="#2b2b2b00") +
  geom_segment(data=eip_state, aes(x="North Carolina", xend="North Carolina", y=-Inf, yend=Inf), size=5, color="#cccccc", alpha=1/10) +
  geom_linerange(data=eip_state, aes(state, ymin=PEIIndexi_lci, ymax=PEIIndexi_hci), size=0.25, color="#2b2b2b") +
  geom_point(data=eip_state, aes(state, PEIIndexi, fill=responserate), size=2, shape=21, color="#2b2b2b", stroke=0.5) +
  scale_y_continuous(expand=c(0,0.1), limits=c(0,100)) +
  viridis::scale_fill_viridis(name="Response rate\n", label=scales::percent) +
  labs(x="Vertical lines show upper & lower bounds of the 95% confidence interval\nSource: PEI Dataverse (https://dataverse.harvard.edu/dataset.xhtml?persistentId=doi:10.7910/DVN/YXUV3W)\nNorris, Pippa; Nai, Alessandro; Grömping, Max, 2016, 'Perceptions of Electoral Integrity US 2016 (PEI_US_1.0)'\ndoi:10.7910/DVN/YXUV3W, Harvard Dataverse, V1, UNF:6:1cMrtJfvUs9uBoNewfUKqA==",
       y="PEI Index (imputed)",
       title="Perceptions of Electoral Integrity: U.S. 2016 POTUS State Ratings",
       subtitle="The PEI index is designed to provide an overall summary evaluation of expert perceptions that an election\nmeets international standards and global norms. It is generated at the individual level. Unlike the individual\nindex (PEIIndex) PEIIndexi is imputed and thus fully observed for all experts and states.") +
  hrbrmisc::theme_hrbrmstr(grid="Y", subtitle_family="Hind Light", subtitle_size=11) +
  theme(axis.text.x=element_text(angle=90, vjust=0.5, hjust=1)) +
  theme(axis.title.x=element_text(margin=margin(t=15))) +
  theme(legend.position=c(0.8, 0.1)) +
  theme(legend.title.align=1) +
  theme(legend.title=element_text(size=8)) +
  theme(legend.key.size=unit(0.5, "lines")) +
  theme(legend.direction="horizontal") +
  theme(legend.key.width=unit(3, "lines"))

# global ----------------------------------------------------------------------------

eip_world <- read_csv("~/Data/eip_dataverse_files/PEI country-level data (PEI_4.5) 19-08-2016.csv")

arrange(eip_world, PEIIndexi) %>%
  mutate(country=factor(country, levels=country)) -> eip_world

ggplot() +
  geom_linerange(data=eip_world, aes(factor(country), ymin=PEIIndexi_lci, ymax=PEIIndexi_hci), size=0.25, color="#2b2b2b00") +
  geom_linerange(data=eip_world, aes(factor(country), ymin=PEIIndexi_lci, ymax=PEIIndexi_hci), size=0.25, color="#2b2b2b") +
  geom_point(data=eip_world, aes(country, PEIIndexi), size=2, shape=21, fill="steelblue", color="#2b2b2b", stroke=0.5) +
  scale_y_continuous(expand=c(0,0.1), limits=c(0,100)) +
  labs(x="Vertical lines show upper & lower bounds of the 95% confidence interval\nSource: PEI Dataverse (https://dataverse.harvard.edu/dataset.xhtml?persistentId=doi:10.7910/DVN/LYO57K)\nNorris, Pippa; Nai, Alessandro; Grömping, Max, 2016, 'Perceptions of Electoral Integrity (PEI-4.5)\ndoi:10.7910/DVN/LYO57K, Harvard Dataverse, V2",
       y="PEI Index (imputed)",
       title="Perceptions of Electoral Integrity: 2016 Global Ratings",
       subtitle="The PEI index is designed to provide an overall summary evaluation of expert perceptions that an election\nmeets international standards and global norms. It is generated at the individual level. Unlike the individual\nindex (PEIIndex) PEIIndexi is imputed and thus fully observed for all experts and countries") +
  hrbrmisc::theme_hrbrmstr(grid="Y", subtitle_family="Hind Light", subtitle_size=11) +
  theme(axis.text.x=element_blank()) +
  theme(axis.title.x=element_text(margin=margin(t=15)))

It is surprisingly shorter (or longer if you grok regular expressions) than you think it might be: http[s]://.*.

Like it or not, bias is everywhere and tis woefully insidious. “Mainstream media” [MSM]; Alt-left; Alt-right; and, everything in-between creates and promotes “fake” news. Hourly. It always has. Due to the speed at which [dis]information travels now, this is the ultimate era of whatever _you_ believe is “true” is actually “true”, regardless of the morality or (unadulterated, non-theoretical) scientific facts. Sadly, it always has been this way and it always will be this way. Failing to recognize Truth tis the nature of an inherently flawed, broken species.

The reason the MSM is having trouble defining and coming to the grips with “fake news” is that it — itself — has been a witting and unwitting co-conspirator to it since before the invention of the printing press. Tis hard to see the big picture when one navel-gazes so much.

Nobody wants to be wrong and — right now — the only ones who _are_ wrong are those who disagree with _you_. Fundamentally, everyone wants their own aberrations to be normalized and we’re obliging that _in spades_ in our 21st century society. Go. Team.

Rather than sit back and accept said aberrations as the norm, verify **everything** that is presented as “fact”. That may mean opening an honest-to-goodness book or three. Sadly, given the sorry state of public & university libraries, you may need to go to multiple ones to finally get at an actual, real, fact. It may also mean coming to grips with that what you want *so desperately to be “OK”* is actually not OK. Just realize you have permission to be wrong.

Naively believe *nothing* (including this rant blog post). Challenge everything. Seek to recognize, acknowledge and promote Truth wherever it shines. Finally, don’t mistake your own desires for said Truth.

>_The parent proposed a committee made up of parents and teachers of different cultural backgrounds come up with a list of books that are inclusive for all students._

Where’s the [ACLU](https://www.aclu.org/issues/free-speech/artistic-expression/banned-books)? They’d be right there if this was an alt-right’er asking to ban books with salacious content they deem (rightly or wrongly) “inappropriate” or “harmful” to teens. I hope they step up and fight the fight the good fight here.

We’re rapidly losing — or may have already lost (as a society) — the concept of building resilience & strength through adversity. I’m hopeful that the diversity we bring into this country with immigrants and refugees (if the borders don’t close shut or we scare them away) that know what true adversity is will eventually counteract this downward spiral.

Refs:


(mp3 backup in the event they take down the audio record)

When something pops up in the news, on Twitter, Facebook or even (ugh) Gab claiming or teasing findings based on data I believe it’s more important than ever to reply with some polite text and a `#showmethedata` hashtag. We desperately needed it this year and we’re absolutely going to need it in 2017 and beyond.

The catalyst for this is a recent [New Yorker story](http://nymag.com/daily/intelligencer/2016/11/activists-urge-hillary-clinton-to-challenge-election-results.html) about “computer scientists” playing off of heated election emotions and making claims in a non-public, partisan meeting with no release of data to the public or to independent, non-partisan groups with credible, ethical data analysis teams.

I believe agents of parties in power and agents of the parties who want to be in power are going to be misusing, abusing and fabricating data at a velocity and volume we’ve not seen before. If you care about the truth (the real truth, not a “necessary truth” based on an agenda) and are a capable data-worker it’s nigh your civic duty to keep in check those that are want to deceive.

**UPDATE** 2016-11-23 10:30:00 EST

Haderman has an (ugh) [Medium post](https://medium.com/@jhalderm/want-to-know-if-the-election-was-hacked-look-at-the-ballots-c61a6113b0ba#.vvcd9bguw) (ugh for using Medium vs the post content) and, as usual, the media causes more controversy than necessary. He has the best intentions and future confidentiality, integrity and availability of our electoral infrastructure at heart.

The [first public informational video](https://www.greatagain.gov/news/message-president-elect-donald-j-trump.html) from the PEOTUS didn’t add a full transcript of the video to the web site and did not provide (at least as of 0700 EST on 2016-11-22) their own text annotations/captions to the video.

Google’s (YouTube’s) auto-captioning (for the most part) worked and it’s most likely “just good enough” to enable the PETOUS’s team to avoid an all-out A.D.A. violation (which is probably the least of their upcoming legal worries). This is a forgotten small detail in an ever-growing list of forgotten small and large details. I’m also surprised that no progressive web site bothered to put up a transcription for those that need it.

Since “the press” did a terrible job holding the outgoing POTUS accountable during his two terms and also woefully botched their coverage of the 2016 election (NOTE: I didn’t vote for either major party candidate, but did write-in folks for POTUS & veep), I guess it’s up to all of us to help document history.

Here’s a moderately cleaned up version from the auto-generated Google SRT stream, presented without any commentary:

A Message from President-Elect Donald J. Trump

Today I would like to provide the American people with an update on the White House transition and our policy plans for the first 100 days.

Our transition team is working very smoothly, efficiently and effectively. Truly great and talented men and women – patriots — indeed are being brought in and many will soon be a part of our government helping us to make America great again.

My agenda will be based on a simple core principle: putting America first whether it’s producing steel, building cars or curing disease. I want the next generation of production and innovation to happen right here in our great homeland America creating wealth and jobs for American workers.

As part of this plan I’ve asked my transition team to develop a list of executive actions we can take on day one to restore our laws and bring back our jobs (about time) these include the following on trade: I’m going to issue our notification of intent to withdraw from the trans-pacific partnership — a potential disaster for our country. Instead we will negotiate fair bilateral trade deals that bring jobs and industry back onto American shores.

On energy: I will cancel job-killing restrictions on the production of American energy including shale energy and clean coal creating many millions of high-paying jobs. That’s what we want, that’s what we’ve been waiting for.

On regulation I will formulate a role which says that for every one new regulation two old regulations must be eliminated (so important).

For national security I will ask the Department of Defense and the chairman of the Joint Chiefs of Staff to develop a comprehensive plan to protect America’s vital infrastructure from cyberattacks and all other form of attacks.

On immigration: I will direct the Department of Labor to investigate all abuses of visa programs that undercut the American worker.

On ethics reform: as part of our plan to “drain the swamp” we will impose a five-year ban executive officials becoming lobbyists after they leave the administration and a lifetime ban on executive officials lobbying on behalf of a foreign government.

These are just a few of the steps we will take to reform Washington and rebuild our middle class I will provide more updates in the coming days as we work together to make America great again for everyone and I mean everyone.

For those technically inclined, you can grab that feed using the following R code. You’ll first need to ensure Developer Tools is open in your browser and tick the “CC” button in the video before starting the video. Look for a network request that begins with `https://www.youtube.com/api/timedtext` and use the “Copy as cURL” feature (all three major, cross-platform browsers support it), then run the code immediately after it (the `straighten()` function will take the data from the clipboard).

library(curlconverter)
library(httr)
library(xml2)

straighten() %>% 
  make_req() -> req

res <- req[[1]]()

content(res) %>% 
  xml_find_all(".//body/p") %>% 
  xml_text() %>% 
  paste0(collapse="") %>% 
  writeLines("speech.txt")

In this emergent “post-truth” world, we’re all going to need to be citizen data journalists and it’s going to be even more important than ever to ensure any data-driven pieces we write are honest, well-sourced, open to review & civil commentary, plus be fully reproducible. We all will also need to hold those in power — including the media — accountable. Despite whatever leanings you have, cherry-picking data, slicing a bit off the edges of the truth and injecting a bias because of your passionate views that you believe are right are only going to exacerbate the existing problems.