Shortly after I added lollipop charts to ggalt I had a few requests for a dumbbell geom. It wasn’t difficult to do modify the underlying lollipop Geoms to make a geom_dumbbell(). Here it is in action:
library(ggplot2)
library(ggalt) # devtools::install_github("hrbrmstr/ggalt")
library(dplyr)

# from: https://plot.ly/r/dumbbell-plots/
URL <- "https://raw.githubusercontent.com/plotly/datasets/master/school_earnings.csv"
fil <- basename(URL)
if (!file.exists(fil)) download.file(URL, fil)

df <- read.csv(fil, stringsAsFactors=FALSE)
df <- arrange(df, desc(Men))
df <- mutate(df, School=factor(School, levels=rev(School)))

gg <- ggplot(df, aes(x=Women, xend=Men, y=School))
gg <- gg + geom_dumbbell(colour="#686868",
                         point.colour.l="#ffc0cb",
                         point.colour.r="#0000ff",
                         point.size.l=2.5,
                         point.size.r=2.5)
gg <- gg + scale_x_continuous(breaks=seq(60, 160, by=20),
                              labels=sprintf("$%sK", comma(seq(60, 160, by=20))))
gg <- gg + labs(x="Annual Salary", y=NULL,
                title="Gender Earnings Disparity",
                caption="Data from plotly")
gg <- gg + theme_bw()
gg <- gg + theme(axis.ticks=element_blank())
gg <- gg + theme(panel.grid.minor=element_blank())
gg <- gg + theme(panel.border=element_blank())
gg <- gg + theme(axis.title.x=element_text(hjust=1, face="italic", margin=margin(t=-24)))
gg <- gg + theme(plot.caption=element_text(size=8, margin=margin(t=24)))
gg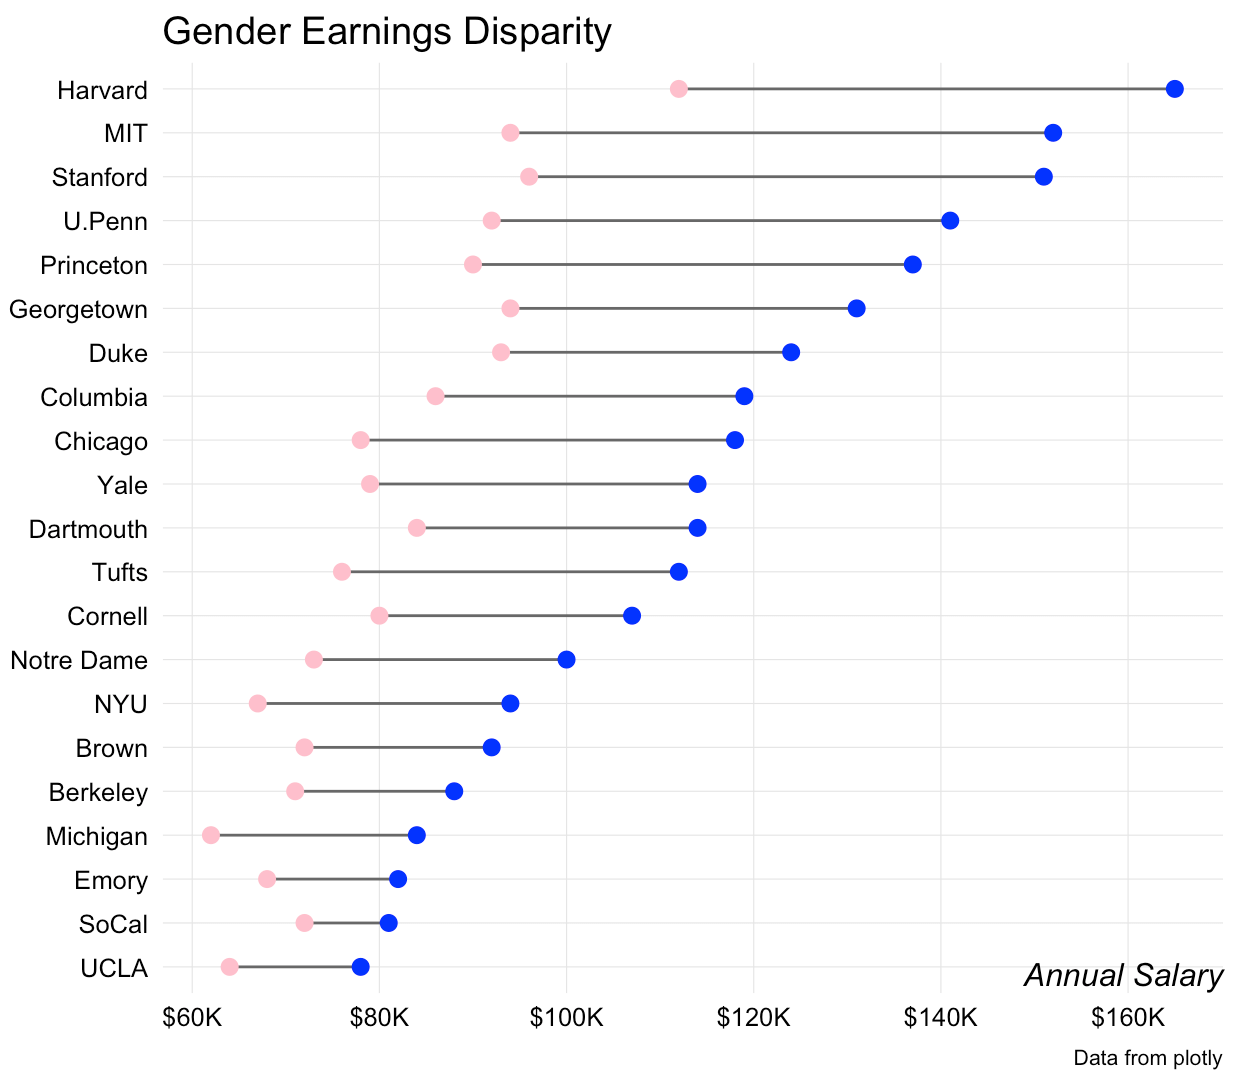
The API isn’t locked in, so definitely file an issue if you want different or additional functionality. One issue I personally still have is how to identify the left/right points (blue is male and pink is female in this one).
Working Out With Dumbbells
I thought folks might like to see behind the ggcurtain. It really only took the addition of two functions to ggalt: geom_dumbbell() (which you call directly) and GeomDumbbell() which acts behind the scenes.
There are a few additional, custom parameters to geom_dumbbell() and the mapped stat and position are hardcoded in the layer call. We also pass in these new parameters into the params list.
geom_dumbbell <- function(mapping = NULL, data = NULL, ...,
                          point.colour.l = NULL, point.size.l = NULL,
                          point.colour.r = NULL, point.size.r = NULL,
                          na.rm = FALSE, show.legend = NA, inherit.aes = TRUE) {

  layer(
    data = data,
    mapping = mapping,
    stat = "identity",
    geom = GeomDumbbell,
    position = "identity",
    show.legend = show.legend,
    inherit.aes = inherit.aes,
    params = list(
      na.rm = na.rm,
      point.colour.l = point.colour.l,
      point.size.l = point.size.l,
      point.colour.r = point.colour.r,
      point.size.r = point.size.r,
      ...
    )
  )
}
The exposed function eventually calls it’s paired Geom. There we get to tell it what are required aes parameters and which ones aren’t required, plus set some defaults.
We automagically add yend to the data in setup_data() (which gets called by the ggplot2 API).
Then, in draw_group() we create additional data.frames and return a list of three Geom layers (two points and one segment). Finally, we provide a default legend symbol.
GeomDumbbell <- ggproto("GeomDumbbell", Geom,
  required_aes = c("x", "xend", "y"),
  non_missing_aes = c("size", "shape",
                      "point.colour.l", "point.size.l",
                      "point.colour.r", "point.size.r"),
  default_aes = aes(
    shape = 19, colour = "black", size = 0.5, fill = NA,
    alpha = NA, stroke = 0.5
  ),

  setup_data = function(data, params) {
    transform(data, yend = y)
  },

  draw_group = function(data, panel_scales, coord,
                        point.colour.l = NULL, point.size.l = NULL,
                        point.colour.r = NULL, point.size.r = NULL) {

    points.l <- data
    points.l$colour <- point.colour.l %||% data$colour
    points.l$size <- point.size.l %||% (data$size * 2.5)

    points.r <- data
    points.r$x <- points.r$xend
    points.r$colour <- point.colour.r %||% data$colour
    points.r$size <- point.size.r %||% (data$size * 2.5)

    gList(
      ggplot2::GeomSegment$draw_panel(data, panel_scales, coord),
      ggplot2::GeomPoint$draw_panel(points.l, panel_scales, coord),
      ggplot2::GeomPoint$draw_panel(points.r, panel_scales, coord)
    )

  },

  draw_key = draw_key_point
)
In essence, this new geom saves calls to three additional geom_s, but does add more parameters, so it’s not really clear if it saves much typing.
If you end up making anything interesting with geom_dumbbell() I encourage you to drop a note in the comments with a link.
No comments yet.