Avast me hearRties! (ok, enough of the pirate speak in a blog post)
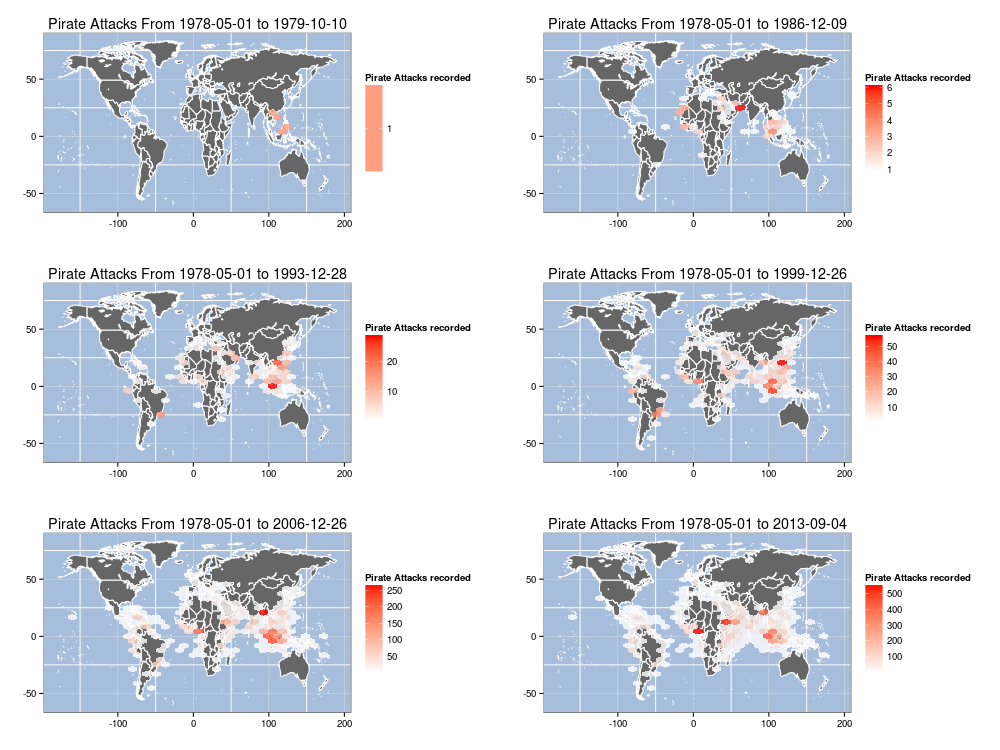
It wouldn’t be TLAPD without out some modest code & idea pilfering from Mark Bulling & Simon Raper. While those mateys did a fine job hoisting up some R code (your really didn’t think I’d stop with the pirate speak, did you?) for their example, I took it one step furrrrther to build an animation of cumulative, yearly IRL pirate attacks from 1978 to the present. I found it a bit interesting to see how the hotspots shifted over time. Click on the graphic for the largeR version or I’ll make ye walk the plank!!.

library(maps)
library(hexbin)
library(maptools)
library(ggplot2)
library(sp)
library(mapproj)

# piRate the data from the militaRy
download.file("http://msi.nga.mil/MSISiteContent/StaticFiles/Files/ASAM_shp.zip", destfile="ASAM_shp.zip")
unzip("ASAM_shp.zip")

# extRact the data fRame we need fRom the shape file
pirates.df <- as.data.frame(readShapePoints("ASAM 19 SEP 13")) # you may need to use a diffeRent name depending on d/l date

# get the woRld map data
world <- map_data("world")
world <- subset(world, region != "Antarctica") # inteRcouRse AntaRctica

# yeaRs we want to loop thoRugh
ends <- 1979:2013

# loop thRough, extRact data, build plot, save plot: BOOM
for (end in ends) {
  png(filename=sprintf("arrr-%d.png",end),width=500,height=250,bg="white") # change to 1000x500 or laRgeR
  dec.df <- pirates.df[pirates.df$DateOfOcc > "1970-01-01" & pirates.df$DateOfOcc < as.Date(sprintf("%s-12-31",end)),]
  rng <- range(dec.df$DateOfOcc)
  p <- ggplot()
  p <- p + geom_polygon(data=world, aes(x=long, y=lat, group=group), fill="gray40", colour="white")
  p <- p + stat_summary_hex(fun="length", data=dec.df, aes(x=coords.x1, y=coords.x2, z=coords.x2), alpha=0.8)
  p <- p + scale_fill_gradient(low="white", high="red", "Pirate Attacks recorded")
  p <- p + theme_bw() + labs(x="",y="", title=sprintf("Pirate Attacks From %s to %s",rng[1],rng[2]))
  p <- p + theme(panel.background = element_rect(fill='#A6BDDB', colour='white'))
  print(p)
  dev.off()
}

# requires imagemagick
system("convert -delay 45 -loop 0 arrr*g arrr500.gif")

12 Comments
This is clean and awesome, good job done!
I am running this code in R 3.0.1 on Windows 7 64 bit OS. I am having trouble running the last command
system(“convert -delay 45 -loop 0 arrr*g arrr500.gif”)
i have already installed imagemagick.
This is the error message I am getting
Invalid Parameter – 45
Warning message:
running command ‘convert -delay 45 -loop 0 arrr*g arrr500.gif’ had status 4
Try replacing
system(…)withshell(…).That worked perfect. Thank you.
I ran this code in R 3.0.1 on Ubuntu 12.04 LTS (64bit). I am done. Thank you so much.
many tks for this post; however i get the following error message
Error in getinfo.shape(filen) : Error opening SHP file
any idea?
One of the comments says “# you may need to use a diffeRent name depending on d/l date”. I suspect you may need to take a look at the unzipped archive to select a new date.
Hi,
I cannot run it either via system or shell command. Here is the output:
  system("convert -delay 45 -loop 0 arrrg arrr500.gif")

  Invalid Parameter - 45

  Warning message:

  running command 'convert -delay 45 -loop 0 arrrg arrr500.gif' had status 4

  shell("convert -delay 45 -loop 0 arrrg arrr500.gif")

  Invalid Parameter - 45

  Warning messages:

  1: running command 'C:\Windows\system32\cmd.exe /c convert -delay 45 -loop 0
arrrg arrr500.gif' had status 4

  2: In shell("convert -delay 45 -loop 0 arrrg arrr500.gif") :

    'convert -delay 45 -loop 0 arrrg arrr500.gif' execution failed with error code 4

  install.packages("imagemagick")

  Warning in install.packages :

    package ‘imagemagick’ is not available (for R version 3.0.2)
It looks like you may not have imagemagick installed. Try installing it from one of the binary packages here: http://www.imagemagick.org/script/binary-releases.php : and re-running the example. As you’re on Windows, you’ll need to use the
shell()function vssystem()I use ubuntu 12.04 LTS (64bit). I also can not run system(“convert -delay 45 -loop 0 arrrg arrr500.gif”). And I searched on google and I found it:
How to install imagemagick on Ubuntu
$sudo apt-get install libmagickwand-devworks well for Ubuntu 12.10
This is assuming you have installed all other dependencies viz.
$sudo apt-get install imagemagick ruby ruby-dev gemAnd use imagemagick
requires(imagemagick)install.packages("imagemagick")
library(imagemagick)
Hope it help you.
Was wondering what form of imagemagik is required for this. Ive been trying to download different types of the application and it doesn’t seem to be working. Also how do you get it into R. Im working from a Mac. Thank you for your time.
Hey Hiller! I’m an OS X R user as well. I use homebrew – http://brew.sh – for package management and have imagemagick installed via
brew install imagemagick. I just tried the code from the post today (changing2013&13references to2014&14and using theASAM 02 DEC 14shapefile) and it all worked fine. I don’t use the R imagemagick package as it’s (to me) just as easy to do the finalsystemcall to use it via shell.3 Trackbacks/Pingbacks
[…] of the changes in each version) and world from the package maps (speaking of maps, have a look at this great dynamic map by Bob […]
[…] that’s an animated map of pirate attacks made in R. With ggplot2 to […]
[…] covered the Anti-shipping Activity Messages (ASAM) Database before for TLAPD before but getting, updating and working with the data has more pain points than it […]