I caught this “gem” in the Wall Street Journal tonight:
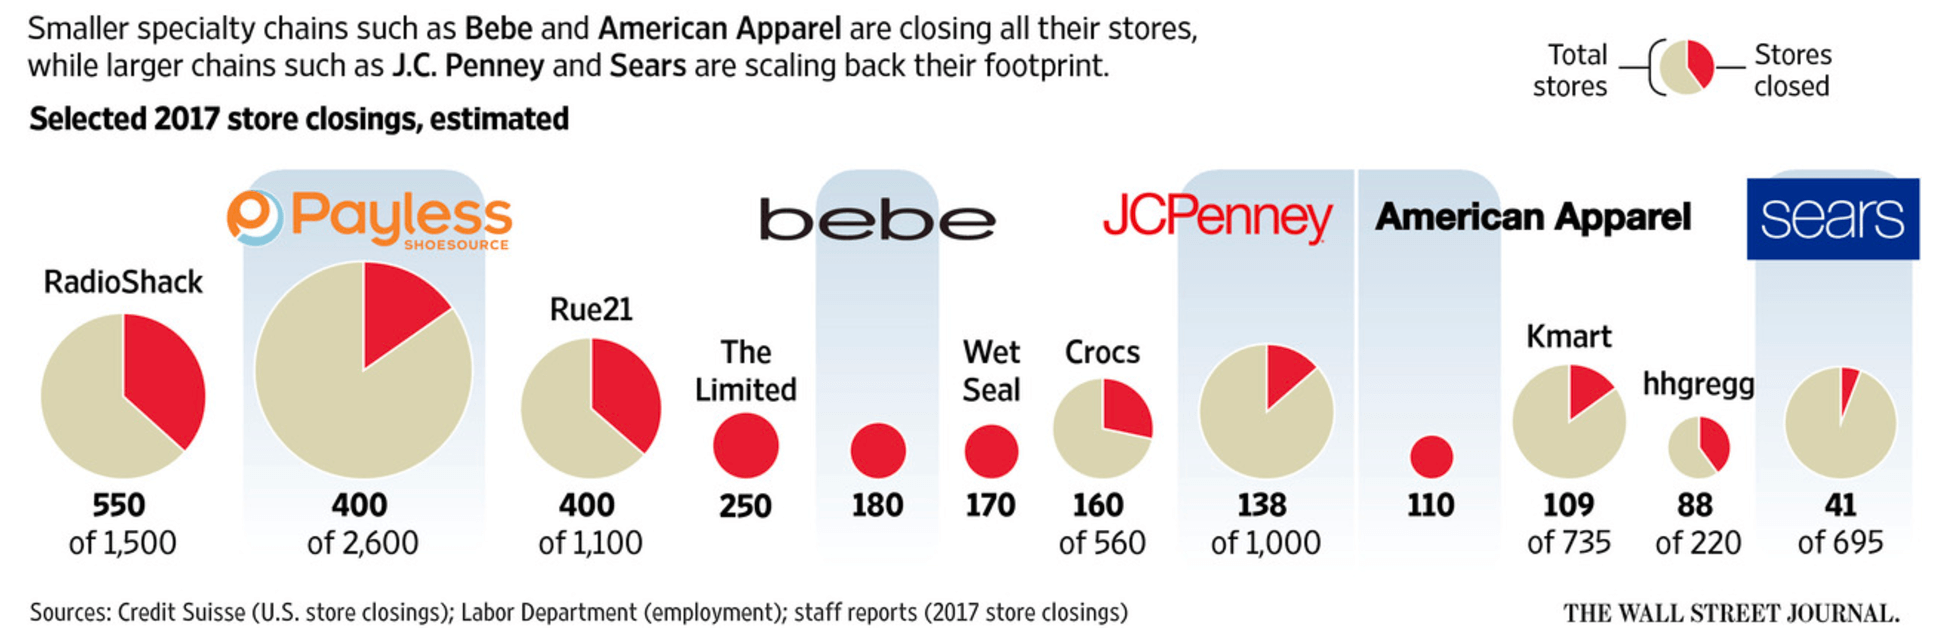
It’s pretty hard to compare store-to-store, even though it is fairly clear which ones are going-going-gone. If we want to see the relative percentage of each store closing and also want to see how they stack up against each other, then let’s make a column of 100% bars and label total stores in each:
library(hrbrthemes)
library(tidyverse)

read.table(text='store,closing,total
"Radio Shack",550,1500
"Payless",400,2600
"Rue21",400,1100
"The Limited",250,250
"bebe",180,180
"Wet Seal",170,170
"Crocs",160,560
"JCPenny",138,1000
"American Apparel",110,110
"Kmart",109,735
"hhgregg",88,220
"Sears",41,695', sep=",", header=TRUE, stringsAsFactors=FALSE) %>%
  as_tibble() %>%
  mutate(remaining = total - closing,
         gone = round((closing/total) * 100)/100,
         stay = 1-gone,
         rem_lab = ifelse(remaining == 0, "", scales::comma(remaining))) %>%
  arrange(desc(stay)) %>%
  mutate(store=factor(store, levels=store)) -> closing_df

update_geom_font_defaults(font_rc)

ggplot(closing_df) +
  geom_segment(aes(0, store, xend=gone, yend=store, color="Closing"), size=8) +
  geom_segment(aes(gone, store, xend=gone+stay, yend=store, color="Remaining"), size=8) +
  geom_text(aes(x=0, y=store, label=closing), color="white", hjust=0, nudge_x=0.01) +
  geom_text(aes(x=1, y=store, label=rem_lab), color="white", hjust=1, nudge_x=-0.01) +
  scale_x_percent() +
  scale_color_ipsum(name=NULL) +
  labs(x=NULL, y=NULL,
       title="Selected 2017 Store closings (estimated)",
       subtitle="Smaller specialty chains such as Bebe and American Apparel are closing their stores,\nwhile lareger chains such as J.C. Penny and Sears are scaling back their footprint.") +
  theme_ipsum_rc(grid="X") +
  theme(axis.text.x=element_text(hjust=c(0, 0.5, 0.5, 0.5, 1))) +
  theme(legend.position=c(0.875, 1.025)) +
  theme(legend.direction="horizontal")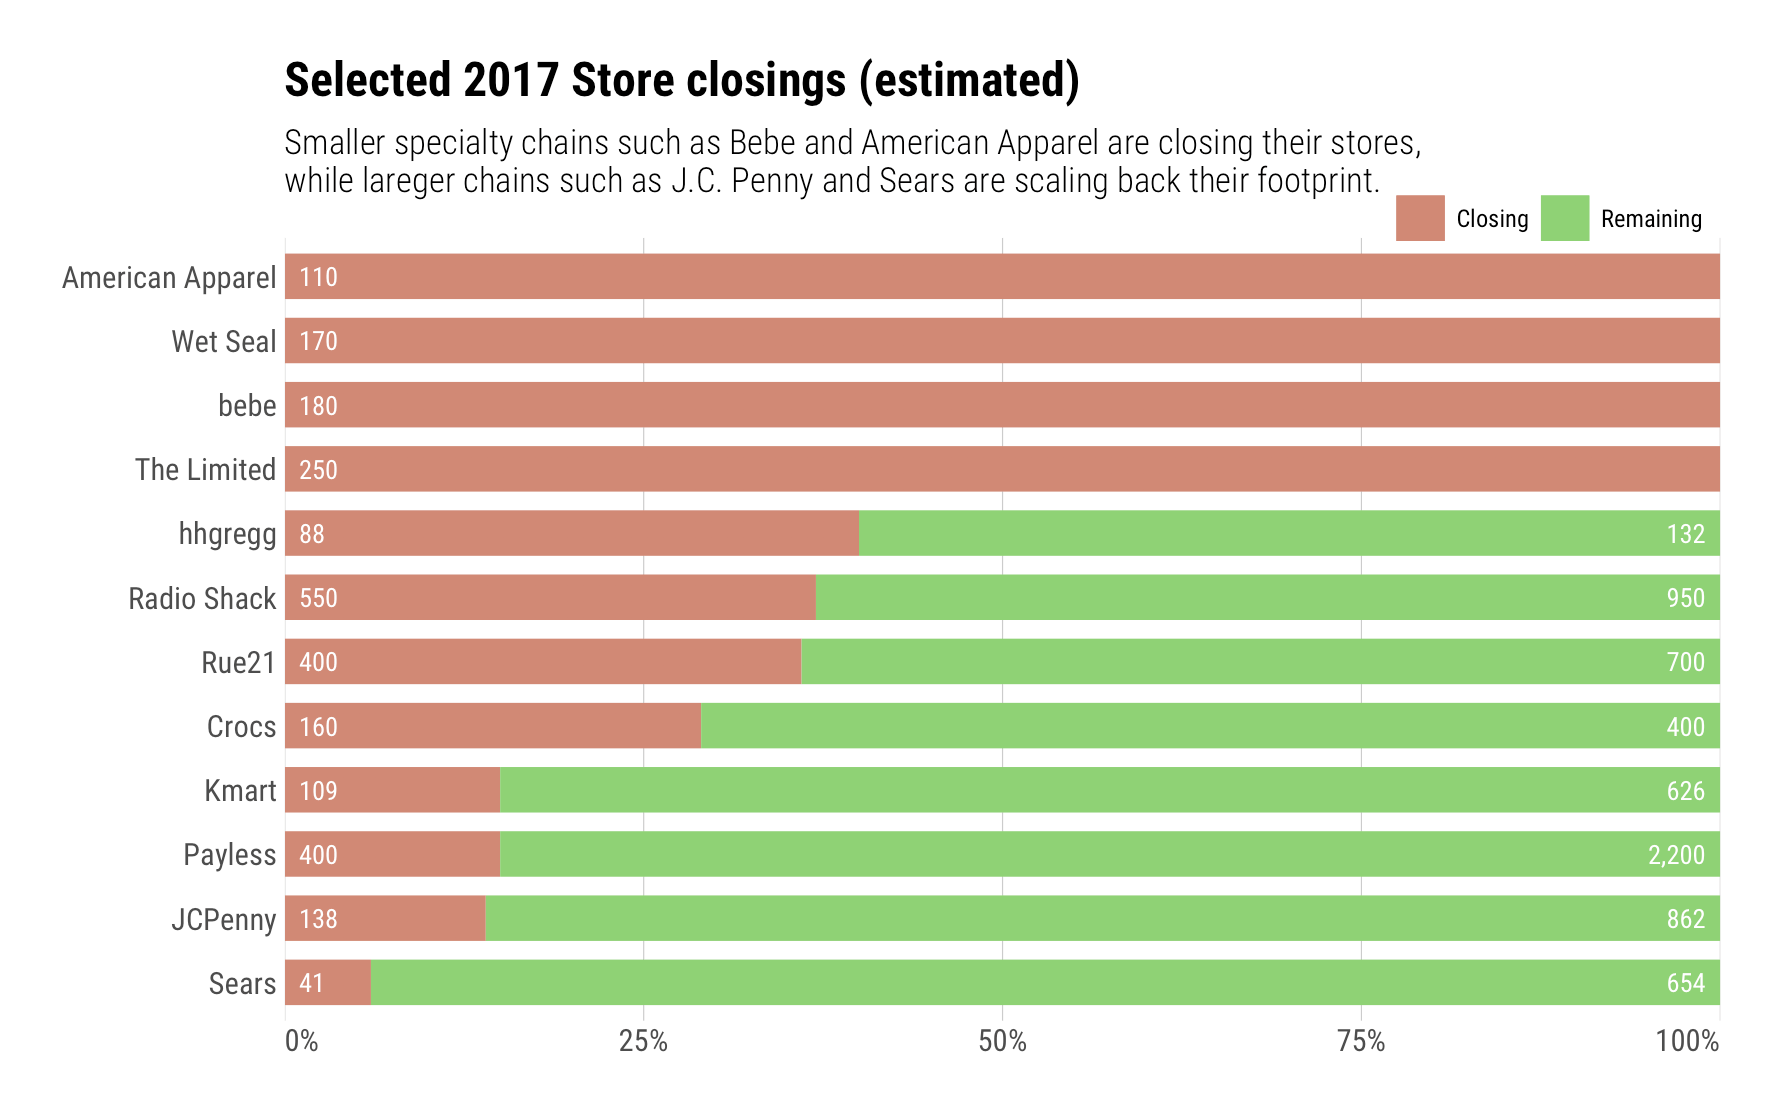
One might try circle packing or a treemap to show both relative store count and percentage, but I think the bigger story is the percent reduction for each retail chain. It’d be cool to see what others come up with.
No comments yet.