We were looking for a different type of visualization for a project at work this past week and my thoughts immediately gravitated towards [streamgraphs](http://www.leebyron.com/else/streamgraph/). The TLDR on streamgraphs is they they are generalized versions of stacked area graphs with free baselines across the x axis. They are somewhat [controversial](http://www.visualisingdata.com/index.php/2010/08/making-sense-of-streamgraphs/) but have a “draw you in” aesthetic appeal (which is what we needed for our visualization).
You can make streamgraphs/stacked area charts pretty easily in D3, and since we needed to try many different sets of data in the streamgraph style, it made sense to make this an R [htmlwidget](http://www.htmlwidgets.org/). Thus, the [streamgraph package](https://github.com/hrbrmstr/streamgraph) was born.
### Making a streamgraph
The package isn’t in CRAN yet, so you have to do the `devtools` dance:
devtools::install_github("hrbrmstr/streamgraph")
Streamgraphs require a continuous variable for the x axis, and the `streamgraph` widget/package works with years or dates (support for `xts` objects and `POSIXct` types coming soon). Since they display categorical values in the area regions, the data in R needs to be in [long format](http://blog.rstudio.org/2014/07/22/introducing-tidyr/) which is easy to do with `dplyr` & `tidyr`.
The package recognizes when years are being used and does all the necessary conversions for you. It also uses a technique similar to `expand.grid` to ensure all categories are represented at every observation (not doing so makes `d3.stack` unhappy).
Let’s start by making a `streamgraph` of the number of movies made per year by genre using the `ggplot2` `movies` dataset:
library(streamgraph)
library(dplyr)

ggplot2::movies %>%
  select(year, Action, Animation, Comedy, Drama, Documentary, Romance, Short) %>%
  tidyr::gather(genre, value, -year) %>%
  group_by(year, genre) %>%
  tally(wt=value) %>%
  streamgraph("genre", "n", "year") %>%
  sg_axis_x(20) %>%
  sg_fill_brewer("PuOr") %>%
  sg_legend(show=TRUE, label="Genres: ")
We can also mimic an example from the [Name Voyager](http://www.bewitched.com/namevoyager.html) project (using the `babynames` R package) but change some of the aesthetics, just to give an idea of how some of the options work:
library(dplyr)
library(babynames)
library(streamgraph)

babynames %>%
 filter(grepl("^(Alex|Bob|Jay|David|Mike|Jason|Stephen|Kymberlee|Lane|Sophie|John|Andrew|Thibault|Russell)$", name)) %>%
  group_by(year, name) %>%
  tally(wt=n) %>%
  streamgraph("name", "n", "year", offset="zero", interpolate="linear") %>%
  sg_legend(show=TRUE, label="DDSec names: ")
There are more examples over at [RPubs](http://rpubs.com/hrbrmstr/streamgraph04) and [github](http://hrbrmstr.github.io/streamgraph/), but I’ll close with a streamgraph of housing data originally made by [Alex Bresler](http://asbcllc.com/blog/2015/february/cre_stream_graph_test/):
dat <- read.csv("http://asbcllc.com/blog/2015/february/cre_stream_graph_test/data/cre_transaction-data.csv")

dat %>%
  streamgraph("asset_class", "volume_billions", "year") %>%
  sg_axis_x(1, "year", "%Y") %>%
  sg_fill_brewer("PuOr") %>%
  sg_legend(show=TRUE, label="Assets: ")
While the radical volume change would have been noticeable in almost any graph style, it’s especially noticeable with the streamgraph version as your eyes tend to naturally follow the curves of the flow.
### Fin
While I wouldn’t have these replace my trusty ggplot2 faceted bar charts for regular EDA and reporting, streamgraphs can add a bit of color and flair, and may be an especially good choice when you need to view many categorical variables over time.
As usual, issues/feature requests on [github](http://github.com/hrbrmstr/streamgraph) and showcase/general feedback in the comments.

14 Comments
devtools::install_github("hrbrmstr/streamgraph")Installing github repo(s) hrbrmstr/streamgraph/master from hadley
Installing hrbrmstr/streamgraph.zip from https://github.com/hadley/hrbrmstr/streamgraph/archive/master.zip
Error: client error: (404) Not Found
>
I’m not sure which version of
devtoolsyou’re using, butdevtools::install_github("hrbrmstr/streamgraph")is working fine on the vanilla test VM (i.e. one that has no knowledge of any of my personal settings) and has worked for at least 10 other folks who’ve tried the package. I’d suggest upgradingdevtoolsand giving it another shot.Oops, ERROR in using older version of devtools package. Make sure to update to current one ! FIX THIS PROBLEM!
install.packages(“devtools”)
library(“devtools”)
Hi there, I came across your streamgraph function and it is brilliant. I just have one question for you; I see you are using “Spectral” as the default palette to generate your plots and I would like to change that to a more customized set of colors. How do I do that?
Aye. Latest version has
sg__fill__manual. Hit up https://github.com/hrbrmstr/streamgraph for the latest version.I competely missed that one!! Thanks mate! It is a very great tool ;)
Powerful stuff! Thanks for sharing. Gonna try my hands on this…
very good stuff … need to try some more examples.
Thanks it was exactly was I was looking for…
How someone can put a title to a streamgraph ?
Hi there,
I see there is a function in there to mess with the order of the streams (or ribbons). However, I can’t seem to just get the order of the imported data. For example, I am looking at plotting octave bands over time and want to start at 12.5 and go upwards but unfortunately I can’t seem to get this. Any ideas?
I’m thinking it is the order command? but asis (what I assume is the imput order, when looking at the help, see below) doesn’t seem to change it.
streamgraph ribbon order. “‘compat'” to match the orignial package behavior, “‘asis'” to use the input order, “‘inside-out'” to sort by index of maximum value, then use balanced weighting, or “‘reverse'” to reverse the input layer order.
Many Thanks,
Jenni
Hi there! Do you have any plans to update the package to be compatible with later versions of R? I’m on 3.6.3 hopeful face
You might want to elaborate given this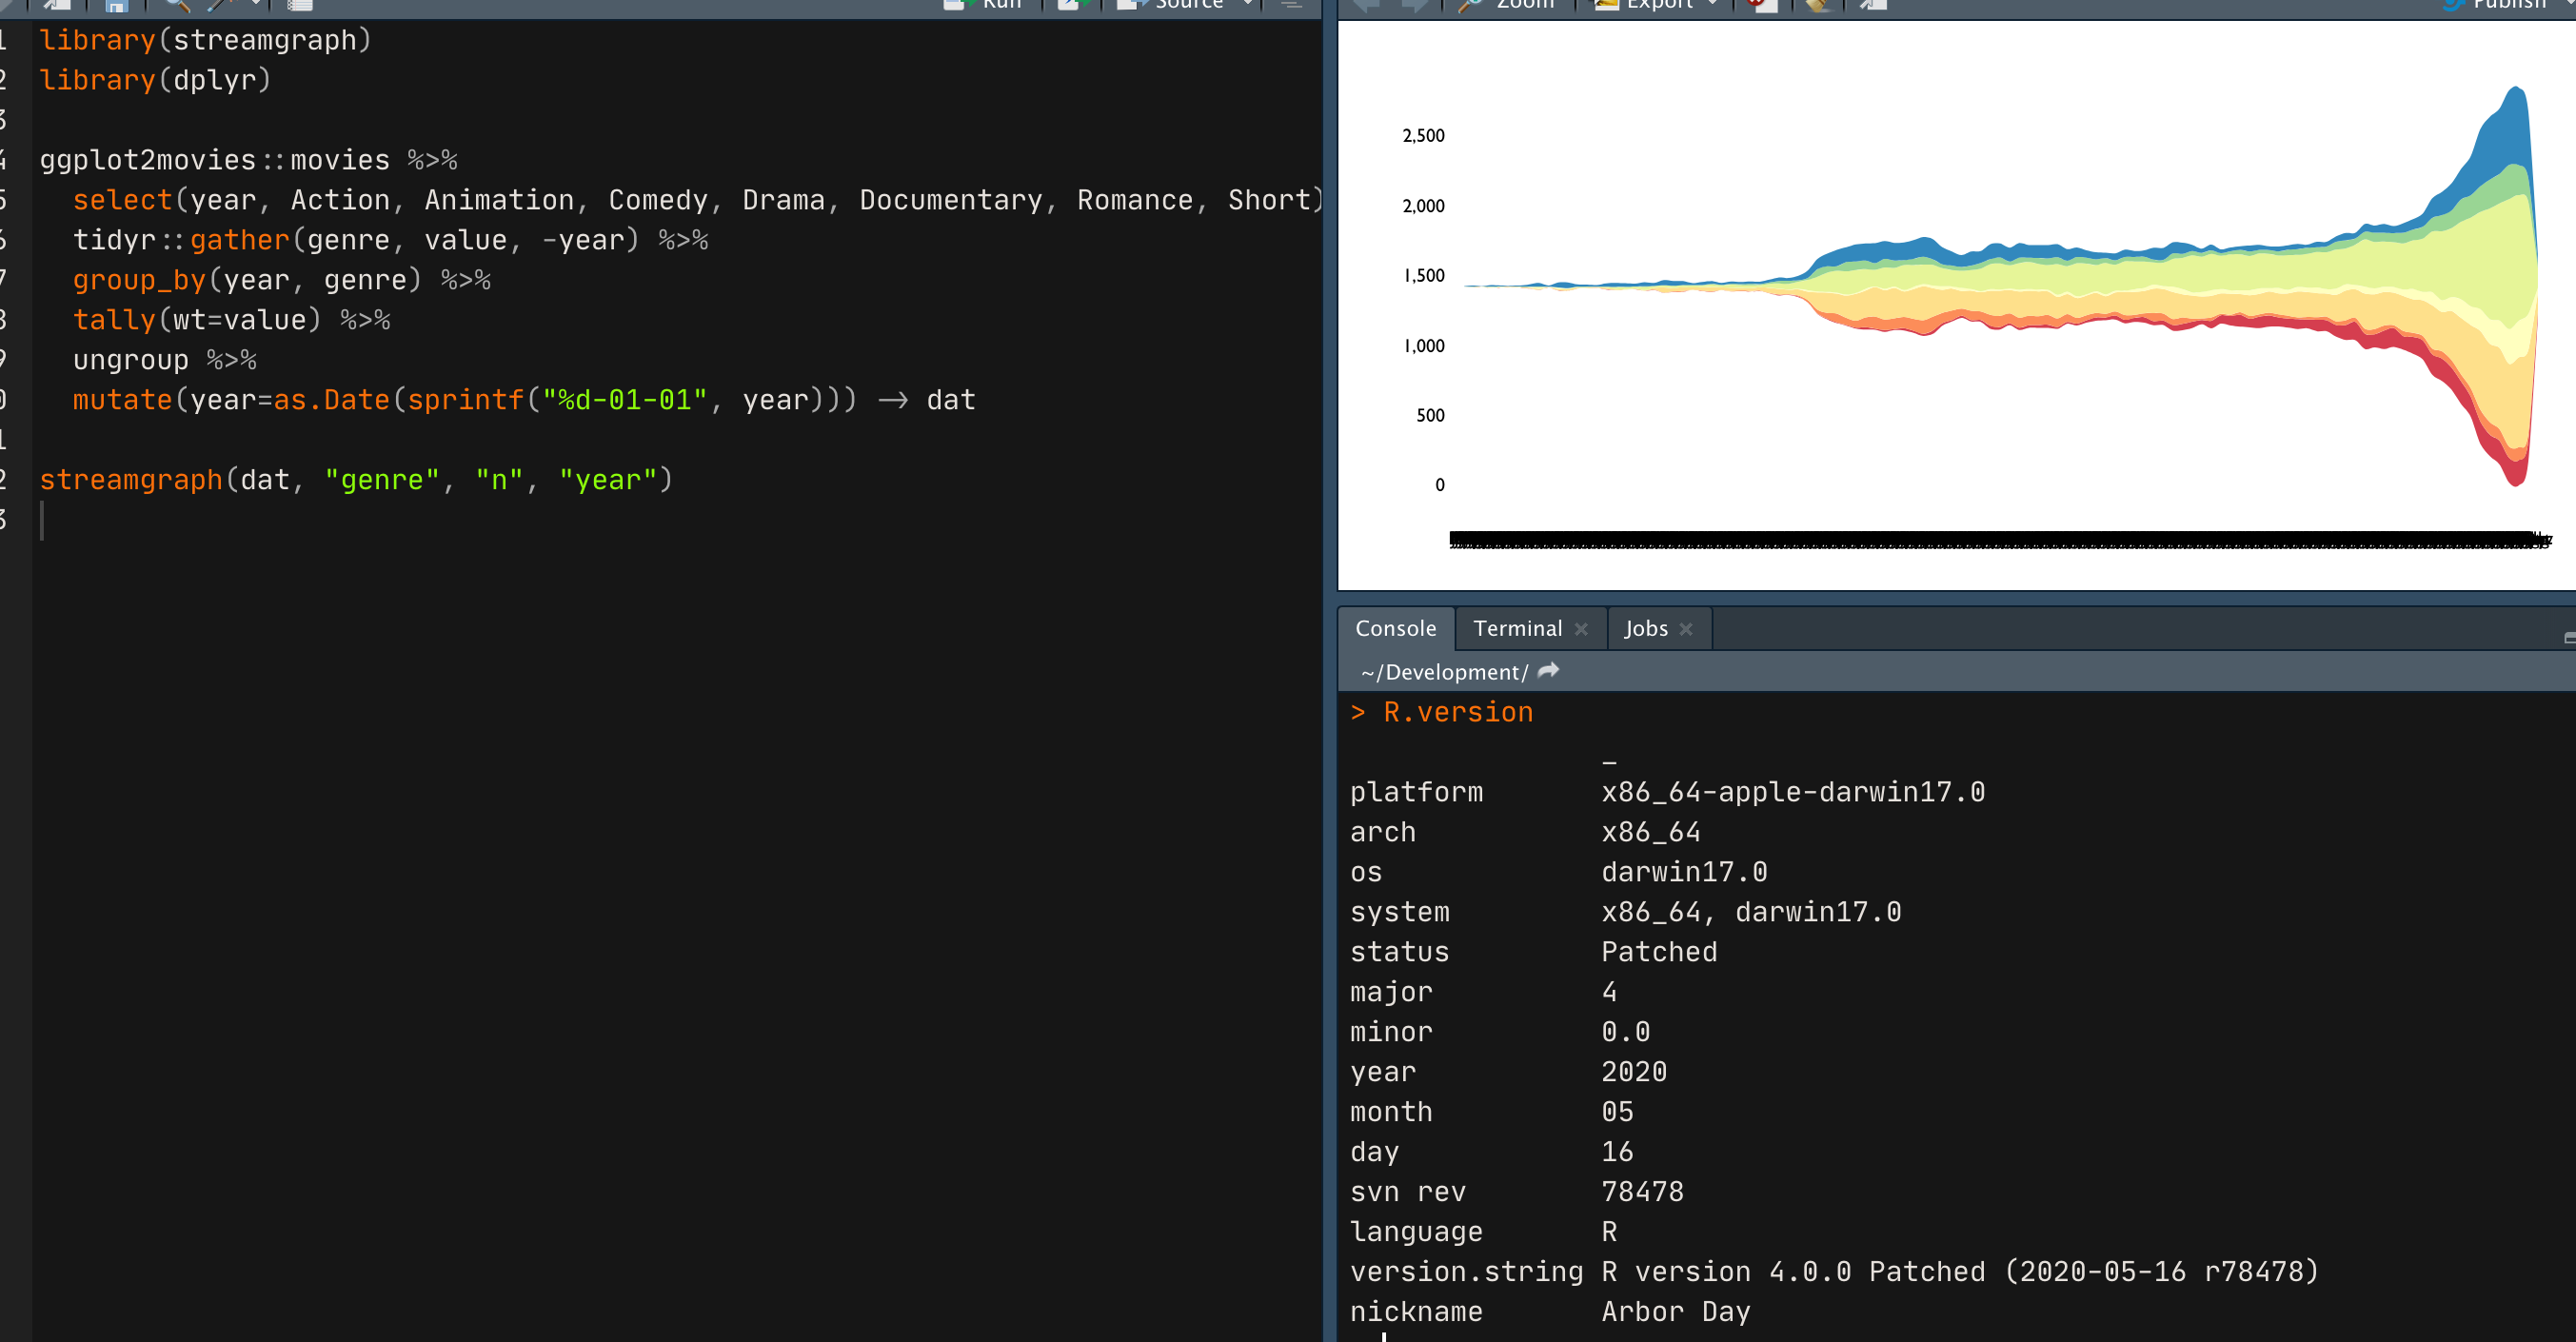
Thank you for the post. How did you get your titles on your streamgraphs?
3 Trackbacks/Pingbacks
[…] across the x axis. They are somewhat controversial but have a “draw you in” […], Security Bloggers Network, hrbrmstr, […]
[…] We were looking for a different type of visualization for a project at work this past week and my thoughts immediately gravitated towards streamgraphs. The TLDR on streamgraphs is they they are generalized versions of stacked area graphs with free baselines across the x axis. They are somewhat controversial but have a “draw you in” […] […]
[…] can easily make interactive streamgraphs like this in R, with the streamgraph package, available on GitHub. The streamgraph function makes use of on htmlwidgets, and has a ggplot2-style […]