Recipe 22 Visualizing Intersecting Follower Sets with UpSetR
22.1 Problem
You want to examine the intersection of twitter followers between a group of definied twitter handles.
22.2 Solution
- Scrape all follower ID’s for each handle
- Combine into one dataframe
- Create de-duplicated list of all followers
- Build a logical matrix to indicate if each follower follows each handle or not
- Plot the intersecting sets with
UpSetR
22.3 Discussion
Set visualization, typically done using Venn diagrams, can become challenging when the number of sets exceeds a a trivial threshold. To address this, the UpSet project was born.
A novel visualization technique for the quantitative analysis of sets, their intersections, and aggregates of intersections.
Thankfully, there is an R package version of the project that we can use with follower data pulled with rtweet. UpSetR requires the data to be in a binary matrix format, so there is some data wrangling work to be done before we can visualize.
First we will make a list of twitter handles we want to compare then scrape all of their followers into a one dataframe using a get_followers function inside a purrr::map_df call. Set n to a number => the max follower count in your set and retryonratelimit = TRUE to ensure you capture all followers. This may take some time depending on how may followers you are scraping.
# get a list of twitter handles you want to compare
rstaters <- c("dataandme",
              "JennyBryan",
              "hrbrmstr",
              "xieyihui",
              "drob",
              "juliasilge",
              "thomasp85")

# scrape the user_id of all followers for each handle in the list and bind into 1 dataframe
followers <- rstaters %>%
  map_df(~ get_followers(.x, n = 20000, retryonratelimit = TRUE) %>%
           mutate(account = .x))

head(followers)
## # A tibble: 6 x 2
## user_id account
## <chr> <chr>
## 1 347516627 dataandme
## 2 86786449 dataandme
## 3 901331045353754624 dataandme
## 4 916260332598906881 dataandme
## 5 245066121 dataandme
## 6 828212430345994240 dataandme## # A tibble: 6 x 2
## user_id account
## <chr> <chr>
## 1 92966425 thomasp85
## 2 3295717490 thomasp85
## 3 219555432 thomasp85
## 4 113125081 thomasp85
## 5 2282250918 thomasp85
## 6 2336317420 thomasp85Next we form a binary matrix by using an ifelse inside another map_df to ascertain whether or not each follower in the master list follows each of the twitter handles.
# get a de-duplicated list of all followers
aRdent_followers <- unique(followers$user_id)

# for each follower, get a binary indicator of whether they follow each tweeter or not and bind to one dataframe
binaries <- rstaters %>%
  map_dfc(~ ifelse(aRdent_followers %in% filter(followers, account == .x)$user_id, 1, 0) %>%
            as.data.frame) # UpSetR doesn't like tibbles

# set column names
names(binaries) <- rstaters

# have a look at the data
glimpse(binaries)
## Observations: 58,813
## Variables: 7
## $ dataandme <dbl> 1, 1, 1, 1, 1, 1, 1, 1, 1, 1, 1, 1, 1, 1, 1, 1, 1, ...
## $ JennyBryan <dbl> 1, 1, 1, 1, 0, 1, 0, 0, 1, 1, 0, 1, 0, 0, 0, 0, 0, ...
## $ hrbrmstr <dbl> 0, 0, 0, 0, 0, 0, 0, 0, 0, 0, 0, 1, 0, 0, 0, 0, 0, ...
## $ xieyihui <dbl> 1, 0, 0, 0, 0, 1, 0, 0, 0, 0, 0, 0, 0, 0, 0, 0, 0, ...
## $ drob <dbl> 1, 1, 1, 0, 0, 0, 0, 0, 1, 0, 1, 1, 0, 0, 0, 0, 0, ...
## $ juliasilge <dbl> 1, 1, 1, 0, 0, 1, 0, 0, 1, 1, 1, 0, 0, 0, 0, 0, 0, ...
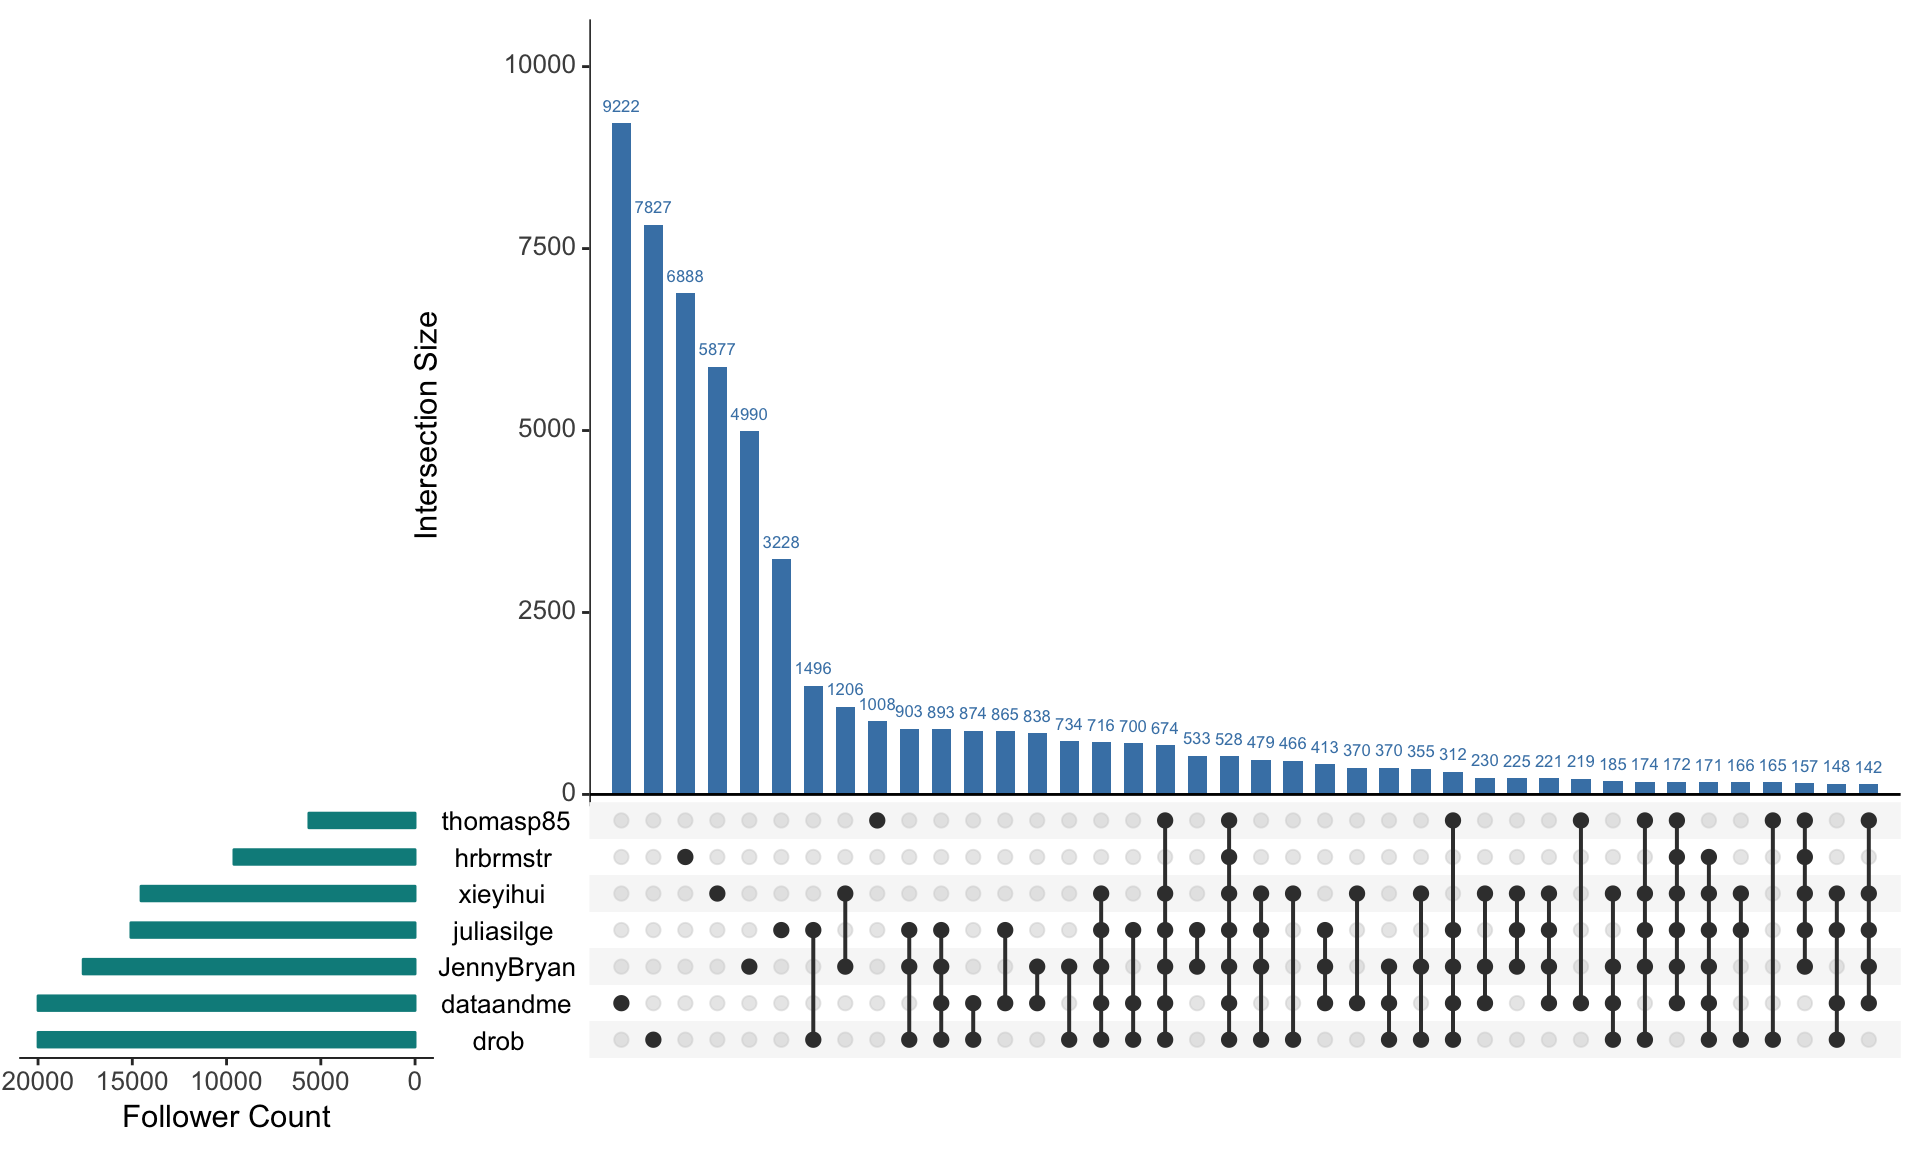
## $ thomasp85 <dbl> 1, 0, 0, 0, 0, 1, 0, 0, 1, 0, 0, 1, 1, 0, 0, 0, 0, ...Finally, we let UpSetR work its magic on the matrix and visualize the intersections…
# plot the sets with UpSetR
upset(binaries, nsets = 7, main.bar.color = "SteelBlue", sets.bar.color = "DarkCyan",
      sets.x.label = "Follower Count", text.scale = c(rep(1.4, 5), 1), order.by = "freq")