Recipe 6 Creating a Graph of Retweet Relationships
6.1 Problem
You want to construct and analyze a graph data structure of retweet relationships for a set of query results.
6.2 Solution
Query for the topic, extract the retweet origins, and then use igraph to construct a graph to analyze.
6.3 Discussion
Recipes 4 and 5 introduced and expanded on searching Twitter plus looking for retweets. The igraph package can be used to capture and analyze details of relationships across retweets. We’ll focus on just examining the Twitter user pair relationships.
Let’s get a larger sample this time — 1,500 tweets in #rstats. We can use the technique from the previous recipe and:
- find the retweets (using the API-provided data)
- expand out all the mentioned screen names
- create an
igraphgraph object - look at some summary statistics for the graph
rstats <- search_tweets("#rstats", n=1500)
filter(rstats, retweet_count > 0) %>%
select(screen_name, mentions_screen_name) %>%
unnest(mentions_screen_name) %>%
filter(!is.na(mentions_screen_name)) %>%
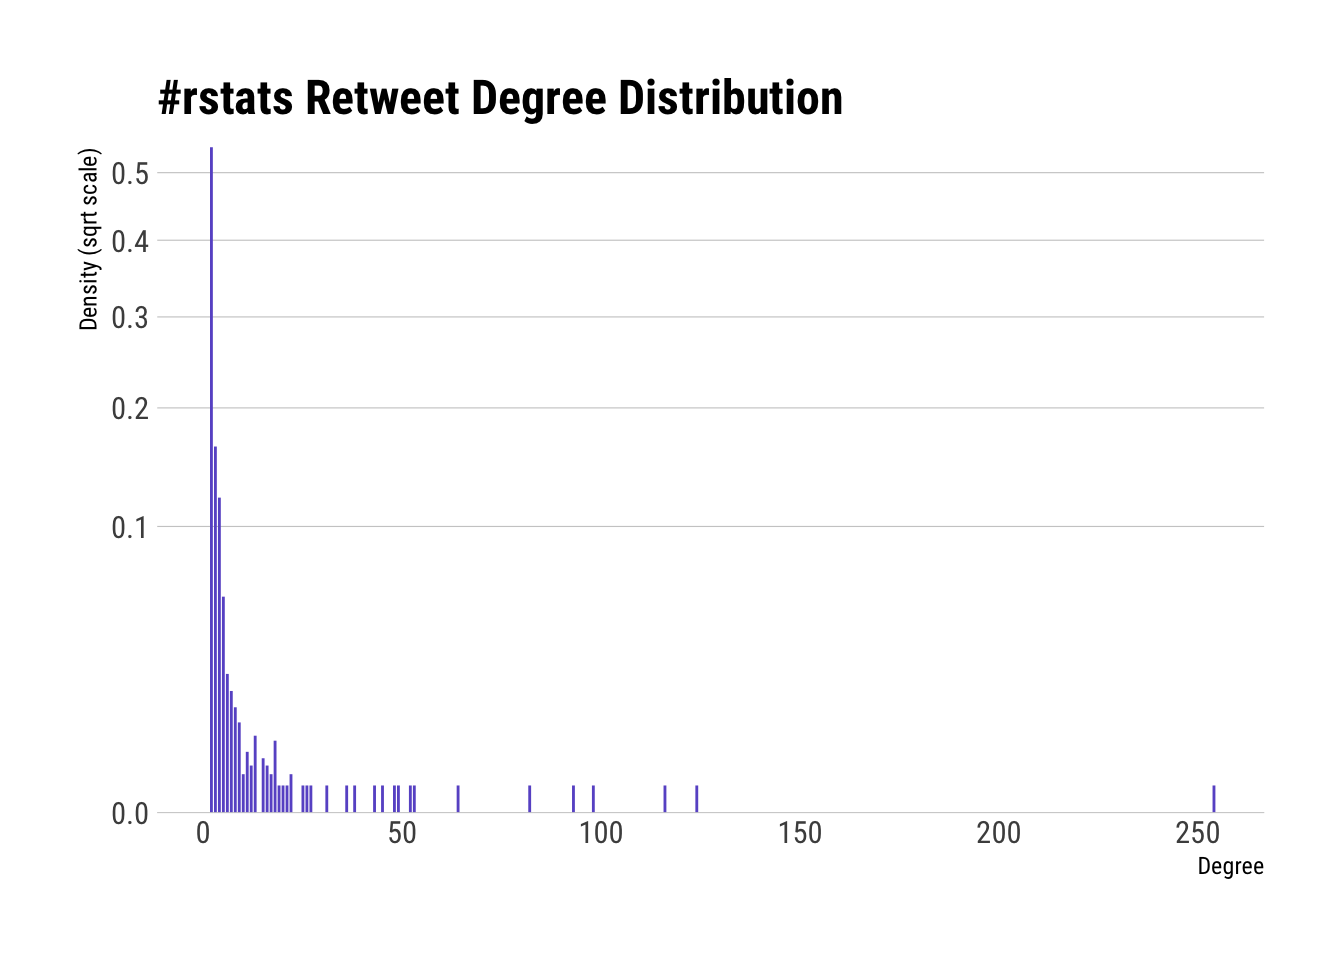
graph_from_data_frame() -> rt_gYou can reference the igraph print() and summary() functions for more information on the output of summary() but output from the following line shows that the graph is Directed with Named vertices and it has 1,106 vertices and 1,945 edges.
## IGRAPH b4b8447 DN-- 1106 1945 --
## + attr: name (v/c)
We’ll produce more visualizations in the next recipe, but the degree of graph vertices is one of the most fundamental properties of a graph and it’s much nicer to see the degree distribution than stare at a wall of numbers:
ggplot(data_frame(y=degree_distribution(rt_g), x=1:length(y))) +
  geom_segment(aes(x, y, xend=x, yend=0), color="slateblue") +
  scale_y_continuous(expand=c(0,0), trans="sqrt") +
  labs(x="Degree", y="Density (sqrt scale)", title="#rstats Retweet Degree Distribution") +
  theme_ipsum_rc(grid="Y", axis="x")