Matt @stiles is a spiffy data journalist at the @latimes and he posted an interesting chart on U.S. Attorneys General longevity (given that the current US AG is on thin ice):
Only Watergate and the Civil War have prompted shorter tenures as AG (if Sessions were to leave now). A daily viz: https://t.co/aJ4KDsC5kC pic.twitter.com/ZoiEV3MhGp
— Matt Stiles (@stiles) July 25, 2017
I thought it would be neat (since Matt did the data scraping part already) to look at AG tenure distribution by party, while also pointing out where Sessions falls.
Now, while Matt did scrape the data, it’s tucked away into a javascript variable in an iframe on the page that contains his vis.
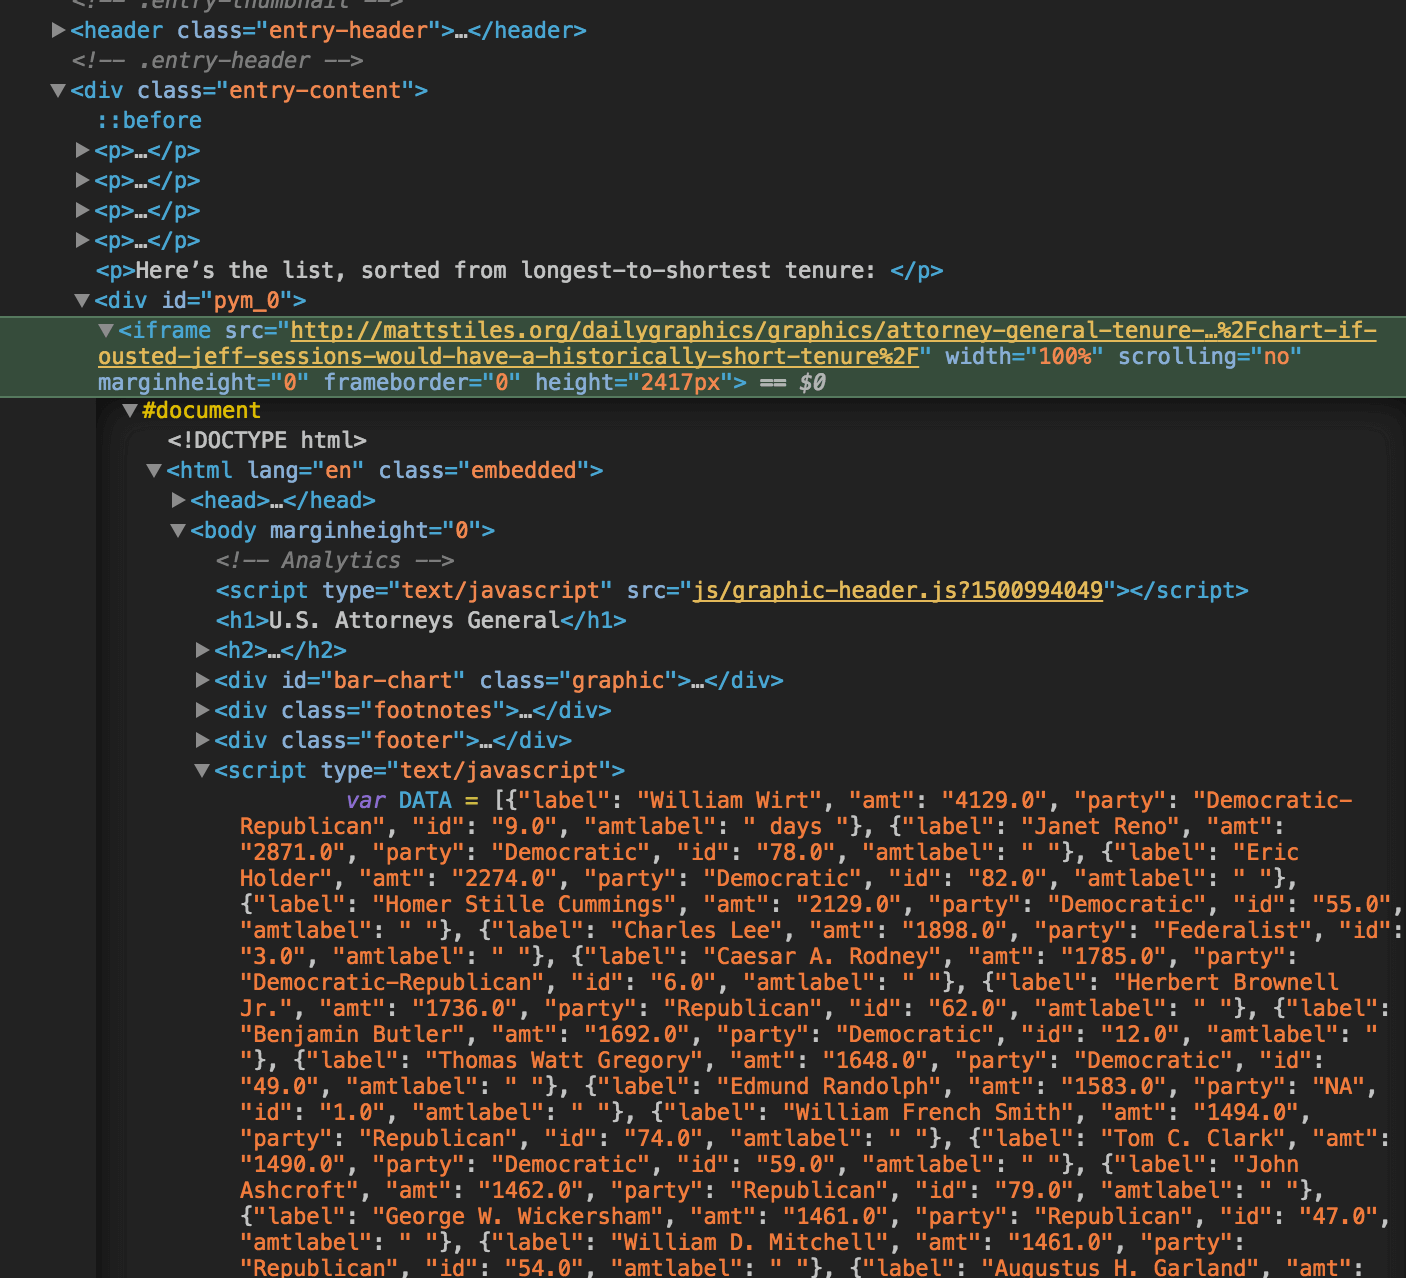
It’s still easier to get it from there vs re-scrape Wikipedia (like Matt did) thanks to the V8 package by @opencpu.
The following code:
- grabs the vis iframe
- extracts and evaluates the target javascript to get a nice data frame
- performs some factor re-coding (for better grouping and to make it easier to identify Sessions)
- plots the distributions using the beeswarm quasirandom alogrithm
library(V8)
library(rvest)
library(ggbeeswarm)
library(hrbrthemes)
library(tidyverse)

pg <- read_html("http://mattstiles.org/dailygraphics/graphics/attorney-general-tenure-20172517/child.html?initialWidth=840&childId=pym_0&parentTitle=Chart%3A%20If%20Ousted%2C%20Jeff%20Sessions%20Would%20Have%20a%20Historically%20Short%20Tenure%20%7C%20The%20Daily%20Viz&parentUrl=http%3A%2F%2Fthedailyviz.com%2F2017%2F07%2F25%2Fchart-if-ousted-jeff-sessions-would-have-a-historically-short-tenure%2F")

ctx <- v8()
ctx$eval(html_nodes(pg, xpath=".//script[contains(., 'DATA')]") %>% html_text())

ctx$get("DATA") %>%
  as_tibble() %>%
  readr::type_convert() %>%
  mutate(party = ifelse(is.na(party), "Other", party)) %>%
  mutate(party = fct_lump(party)) %>%
  mutate(color1 = case_when(
    party == "Democratic" ~ "#313695",
    party == "Republican" ~ "#a50026",
    party == "Other" ~ "#4d4d4d")
  ) %>%
  mutate(color2 = ifelse(grepl("Sessions", label), "#2b2b2b", "#00000000")) -> ags

ggplot() +
  geom_quasirandom(data = ags, aes(party, amt, color = color1)) +
  geom_quasirandom(data = ags, aes(party, amt, color = color2),
                   fill = "#ffffff00", size = 4, stroke = 0.25, shape = 21) +
  geom_text(data = data_frame(), aes(x = "Republican", y = 100, label = "Jeff Sessions"),
            nudge_x = -0.15, family = font_rc, size = 3, hjust = 1) +
  scale_color_identity() +
  scale_y_comma(limits = c(0, 4200)) +
  labs(x = "Party", y = "Tenure (days)",
       title = "U.S. Attorneys General",
       subtitle = "Distribution of tenure in office, by days & party: 1789-2017",
       caption = "Source data/idea: Matt Stiles <bit.ly/2vXAHTM>") +
  theme_ipsum_rc(grid = "XY")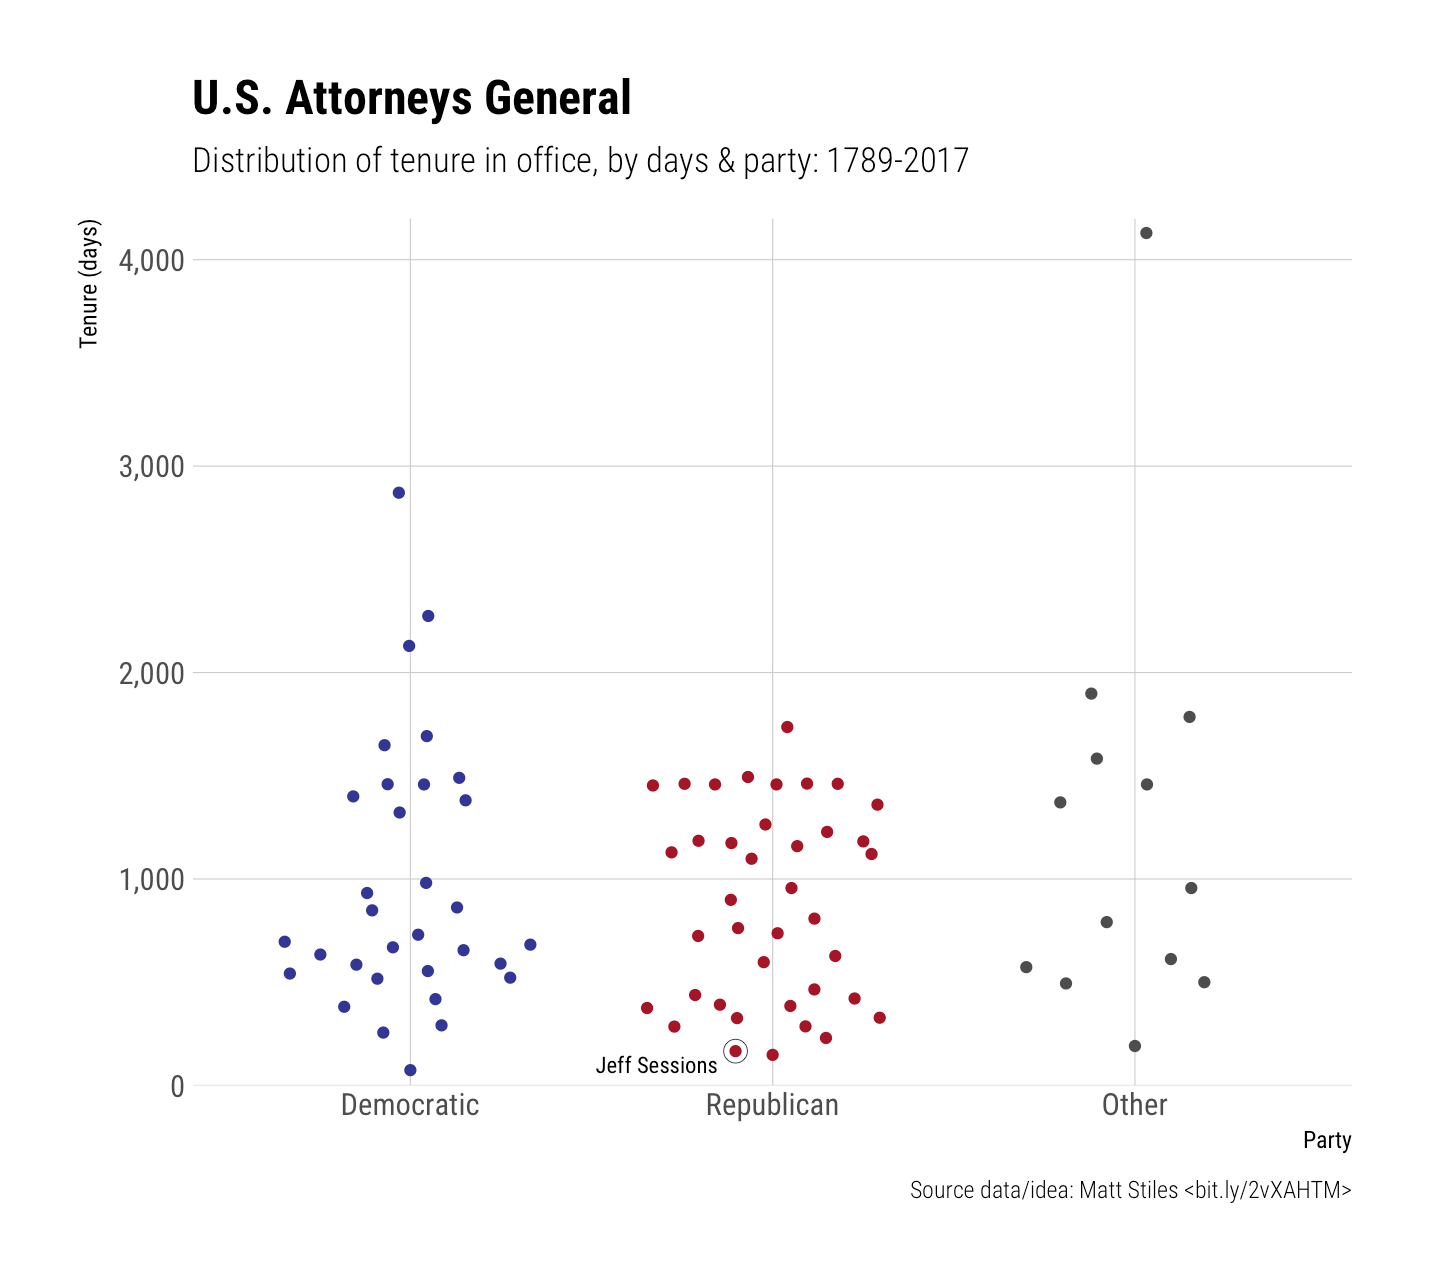
I turned the data into a CSV and stuck it in this gist if folks want to play w/o doing the js scraping.
No comments yet.