If you follow me on Twitter or monitor @Rapid7’s Community Blog you know I’ve been involved a bit in the WannaCry ransomworm triage.
One thing I’ve been doing is making charts of the hourly contribution to the Bitcoin addresses that the current/main attackers are using to accept ransom payments (which you really shouldn’t pay, now, even if you are impacted as it’s unlikely they’re actually giving up keys anymore because the likelihood of them getting cash out of the wallets without getting caught is pretty slim).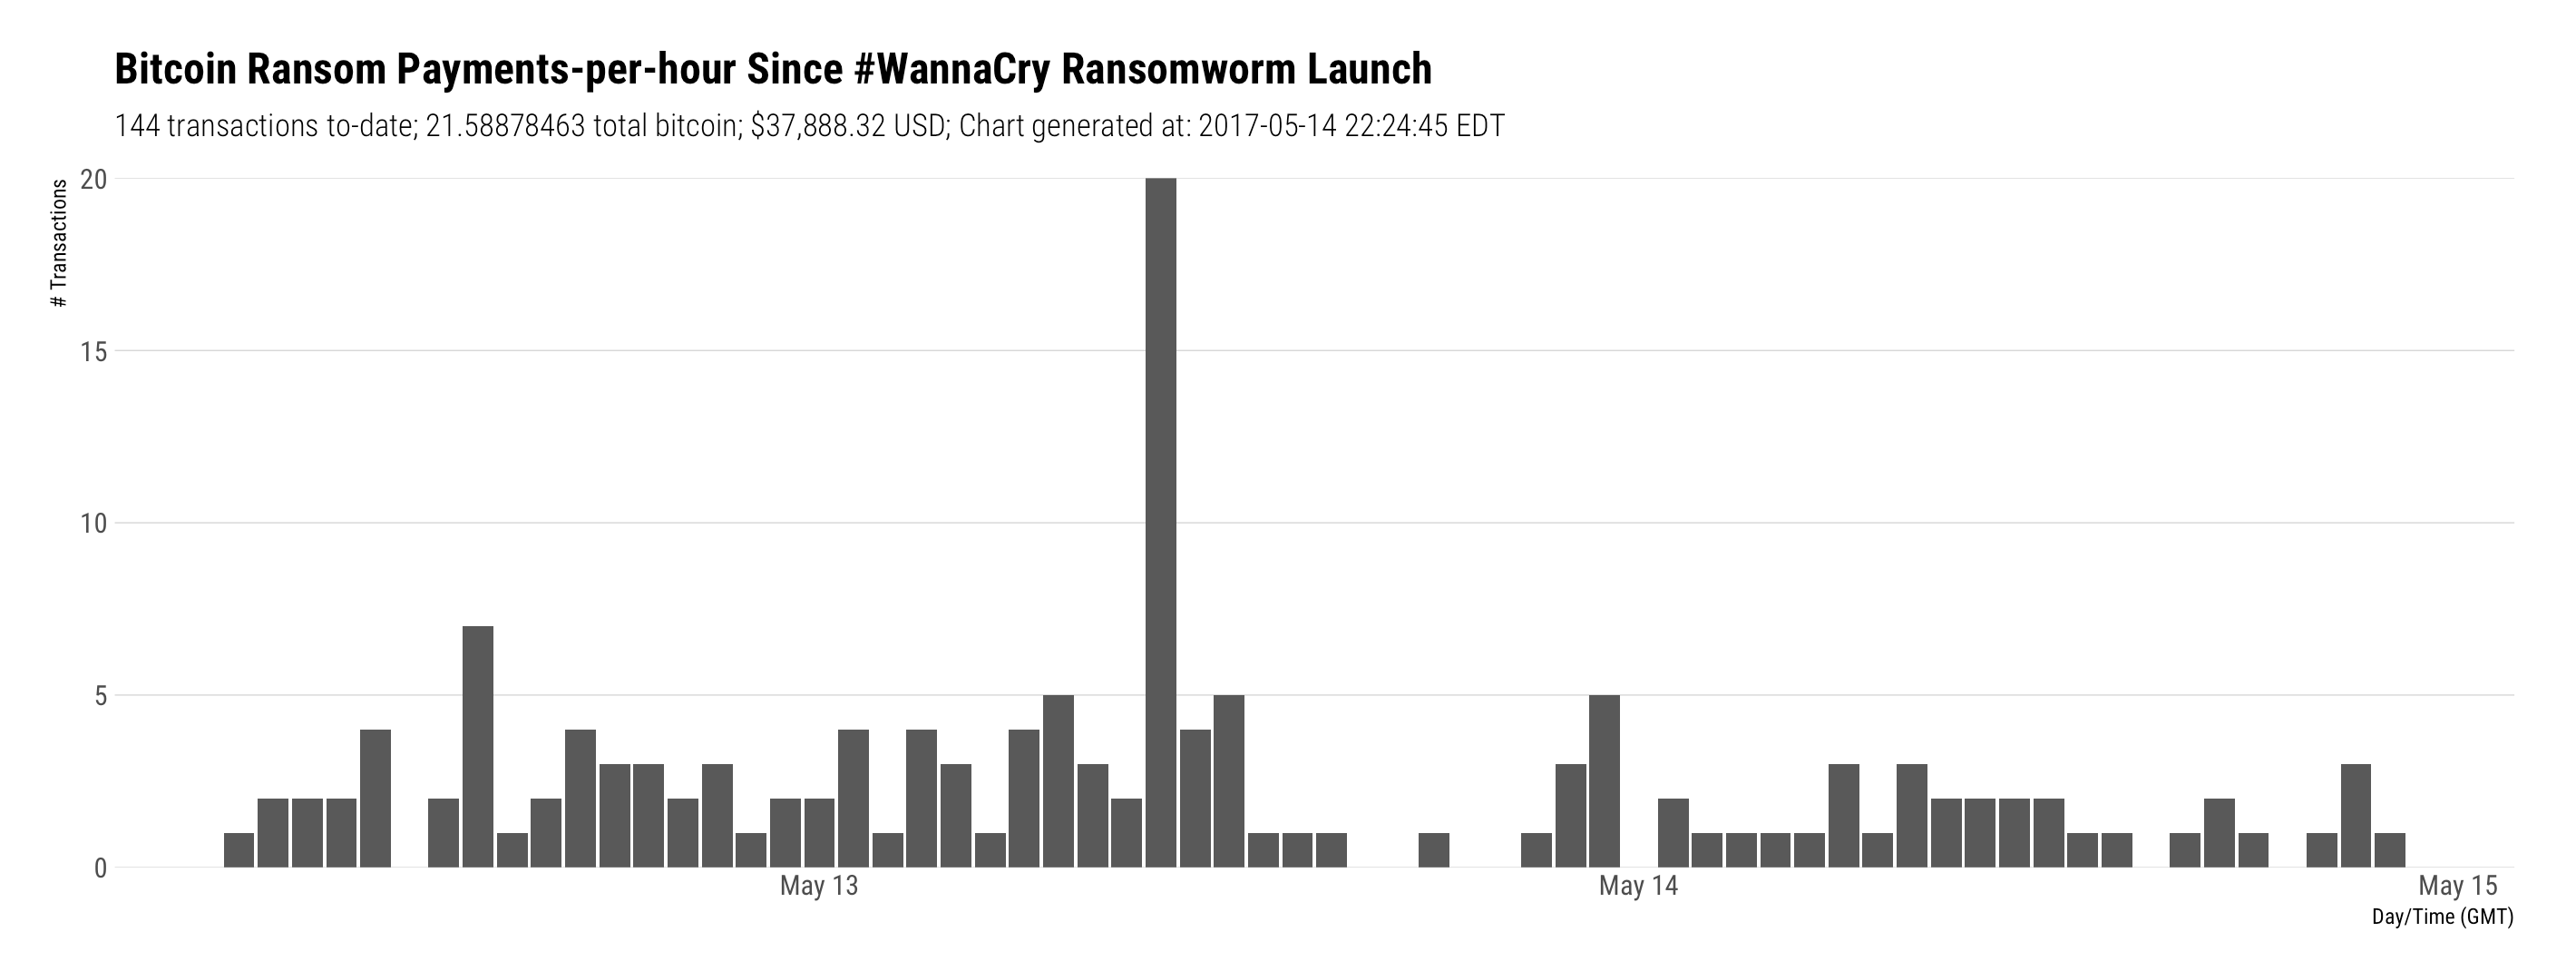
There’s a full-on CRAN-ified Rbitcoin package but I didn’t need the functionality in it (yet) to do the monitoring. I posted a hastily-crafted gist on Friday so folks could play along at home, but the code here is a bit more nuanced (and does more).
In the spirit of these R⁶ posts, the following is presented without further commentary apart from the interwoven comments with the exception that this method captures super-micro-payments that do not necessarily translate 1:1 to victim count (it’s well within ball-park estimates but not precise w/o introspecting each transaction).
library(jsonlite)
library(hrbrthemes)
library(tidyverse)

# the wallets accepting ransom payments

wallets <- c(
  "115p7UMMngoj1pMvkpHijcRdfJNXj6LrLn",
  "12t9YDPgwueZ9NyMgw519p7AA8isjr6SMw",
  "13AM4VW2dhxYgXeQepoHkHSQuy6NgaEb94"
)

# easy way to get each wallet info vs bringing in the Rbitcoin package

sprintf("https://blockchain.info/rawaddr/%s", wallets) %>%
  map(jsonlite::fromJSON) -> chains

# get the current USD conversion (tho the above has this, too)

curr_price <- jsonlite::fromJSON("https://blockchain.info/ticker")

# calculate some basic stats

tot_bc <- sum(map_dbl(chains, "total_received")) / 10e7
tot_usd <- tot_bc * curr_price$USD$last
tot_xts <- sum(map_dbl(chains, "n_tx"))

# This needs to be modified once the counters go above 100 and also needs to
# account for rate limits in the blockchain.info API

paged <- which(map_dbl(chains, "n_tx") > 50)
if (length(paged) > 0) {
  sprintf("https://blockchain.info/rawaddr/%s?offset=50", wallets[paged]) %>%
    map(jsonlite::fromJSON) -> chains2
}

# We want hourly data across all transactions

map_df(chains, "txs") %>%
  bind_rows(map_df(chains2, "txs")) %>%
  mutate(xts = anytime::anytime(time),
         xts = as.POSIXct(format(xts, "%Y-%m-%d %H:00:00"), origin="GMT")) %>%
  count(xts) -> xdf

# Plot it

ggplot(xdf, aes(xts, y = n)) +
  geom_col() +
  scale_y_comma(limits = c(0, max(xdf$n))) +
  labs(x = "Day/Time (GMT)", y = "# Transactions",
       title = "Bitcoin Ransom Payments-per-hour Since #WannaCry Ransomworm Launch",
       subtitle=sprintf("%s transactions to-date; %s total bitcoin; %s USD; Chart generated at: %s EDT",
                        scales::comma(tot_xts), tot_bc, scales::dollar(tot_usd), Sys.time())) +
  theme_ipsum_rc(grid="Y")
I hope all goes well with everyone as you try to ride out this ransomworm storm over the coming weeks. It will likely linger for quite a while, so make sure you patch!
No comments yet.