Andrew Cunningham (@IT_AndrewC) posted an article—If you make PCs and you’re not Lenovo, you might be in trouble—on the always #spiffy @arstechnica that had this horrid table in it:
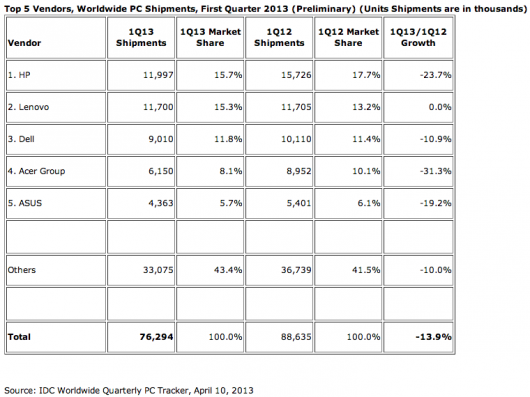
That table was not made by Andrew (so, don’t blame him) but Ars graphics folk could have made the post a bit more readable.
I’m not going to bother making a prettier table (it’s possible, but table formatting is not the point of this post), but I am going to show two slopegraphs that communicate the point of the post (that Lenovo is sitting pretty) much better:
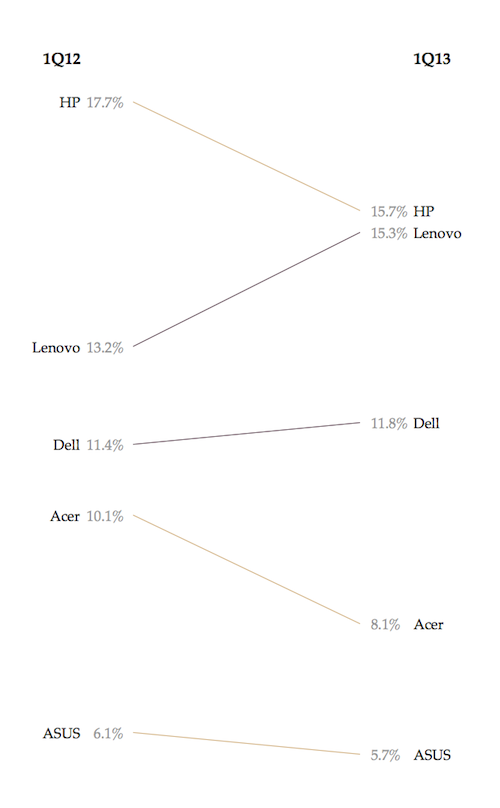
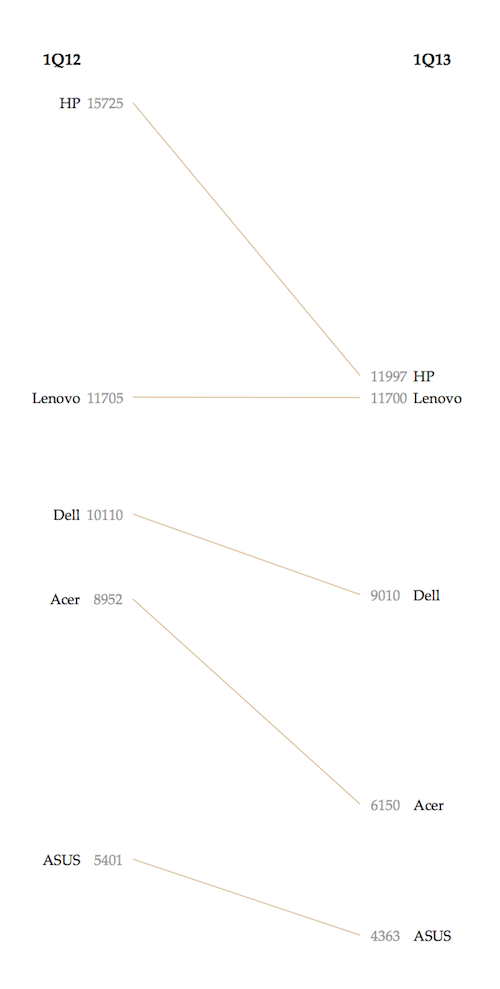
They’re a little long (a problem I’ve noted with slopegraphs previously) but I think they are much better at conveying message intended by the story. I may try to tweak them a bit or even finish the D3 port of my slopegraph library when I’m back from Bahrain.
No comments yet.