ch-08/webr-plot/src/utils.mjs
export async function makeAndMount(ctx, sourceDir, webRMountPoint) {
await ctx.FS.mkdir(webRMountPoint);
await ctx.FS.mount("NODEFS", { root: sourceDir }, webRMountPoint);
}One aspect of R that is the envy of many other programming language environments is the rich ecosystem of built-in tooling and supporting packages that make it possible to produce compelling charts, graphs, and even art. Teams in departments and labs across the globe reply on {ggplot2} to help craft timely views of data that help inform decision makers.
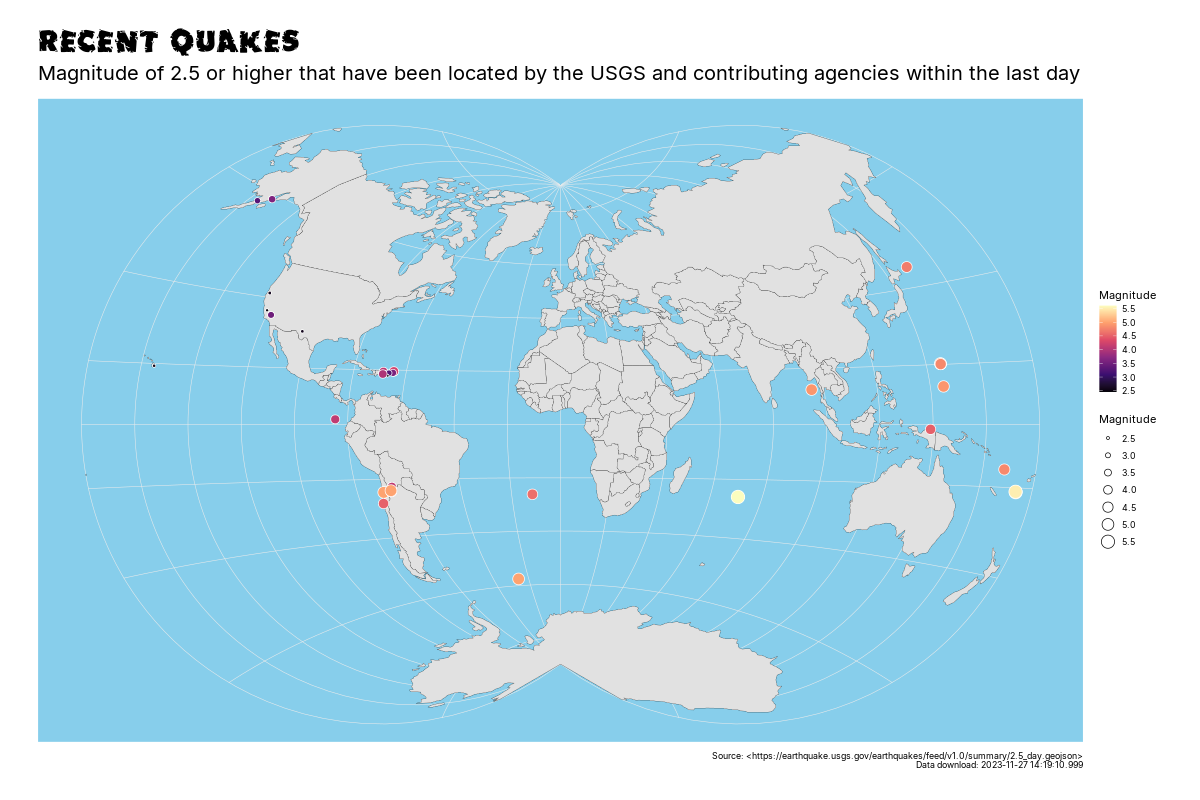
In this chapter, we’ll show how to create a “daily plotter” that reads in data that changes daily — the USGS list of recent earthquakes — and produces a world map that shows the location and magnitude of each quake.
Along the way, we’ll introduce a new “pure WebR” way to download support packages and also how to incorporate fonts into your project.
Colin’s {webrtools} does what it says on the tin, but it has one catch: it requires a local R installation. That’s fine, since it is highly likely that folks making WebR CLI tools will have a local R installation. But, we can use WebR itself to help us gather the necessary primary and dependent packages for our project.
To help with this, I’ve made a small Node CLI tool I’ve dubbed pkgtrap. It takes a list of packages as parameters and will gather them up into a directory you specify by first installing them inside the WebR Emscripten filesystem, then syncing them to the local filesystem (this is a super-cool feature of Node-based WebR). You will need to npm install -g pkgtrap to use as a CLI tool globally.
Here’s a sample execution of from the line in the included ch-08/webr-plot/justfile:
$ pkgtrap dplyr ggplot2 sf
Mounting output directory to WebR's Emscripten filesystem…
Installing designated packages…
Downloading webR package: cli
Downloading webR package: generics
Downloading webR package: glue
Downloading webR package: rlang
Downloading webR package: lifecycle
Downloading webR package: magrittr
Downloading webR package: fansi
Downloading webR package: utf8
Downloading webR package: vctrs
Downloading webR package: pillar
Downloading webR package: R6
Downloading webR package: pkgconfig
Downloading webR package: tibble
Downloading webR package: withr
Downloading webR package: tidyselect
Downloading webR package: dplyr
Downloading webR package: gtable
Downloading webR package: isoband
Downloading webR package: MASS
Downloading webR package: lattice
Downloading webR package: nlme
Downloading webR package: Matrix
Downloading webR package: mgcv
Downloading webR package: farver
Downloading webR package: labeling
Downloading webR package: colorspace
Downloading webR package: munsell
Downloading webR package: RColorBrewer
Downloading webR package: viridisLite
Downloading webR package: scales
Downloading webR package: ggplot2
Downloading webR package: class
Downloading webR package: proxy
Downloading webR package: e1071
Downloading webR package: KernSmooth
Downloading webR package: classInt
Downloading webR package: DBI
Downloading webR package: Rcpp
Downloading webR package: wk
Downloading webR package: s2
Downloading webR package: units
Downloading webR package: sf
Downloading webR package: fs
Syncing packages to /Users/hrbrmstr/projects/webr-cli-book/support/ch-08/webr-plot/pkgs
Done!
By default, pkgtrap will default to syncing the packages to a pkg directory in the current working directory. This is intentional, since it is likely not useful outside of writing WebR CLIs or Node-based web apps.
We’ve removed the {webrtools} dependency from our project and are doing a bit more work with the filesystem, so let’s introduce a new utils.mjs JavaScript file that will hold some helpers for us. One of the first ones is a function that will help us make an Emscripten directory and mount a local filesystem directory to it (a step we’ve done many times, now):
ch-08/webr-plot/src/utils.mjs
export async function makeAndMount(ctx, sourceDir, webRMountPoint) {
  await ctx.FS.mkdir(webRMountPoint);
  await ctx.FS.mount("NODEFS", { root: sourceDir }, webRMountPoint);
}
Inside our index.mjs we’ll add a line that uses it:
await makeAndMount(webR, appDir('pkgs'), '/pkgs')And, we’ll add one more on the JavaScript side to ensure WebR knows we have an additional place to look for packages:
await webR.evalRVoid(`.libPaths(c("/pkgs", .libPaths()))`)WebR expects to find additional fonts in /home/web_user/fonts. We can bundle (TTF) fonts with our Node CLI and mount this directory. I’ve included the latest version of the Inter font, along with a fun “earthquakes” font just to show the possibilities. They’re in ch-08/webr-plot/fonts.
We’ll make use of another helper utility function appDir() which provides a shortcut to figuring out where our CLI app got installed so we can access those resources:
await makeAndMount(webR, appDir('fonts'), '/home/web_user/fonts')It does callers of your CLI almost no good if you shunt plots to somewhere deep inside a node_modules folder they have no idea how to find. That means we need to add a way (via commander on the JS-side) to let them specify where plot output should go:
.option('-o, --output-dir <dir>', `path to output directory where plots will go (must exist)`, "./")It defaults to the current working directory of the user if no directory is specified.
This project also has a local data folder we’ll map to WebR via:
await makeAndMount(webR, appDir('data'), '/data')There are a couple GeoJSON files you can play with in there. We just used one of them in the project.
We also need to fetch the 24-hour magnitude 2.5+ feed from the USGS, and we do that via fetch() on the JS-side, then shunt it into a global variable that sf::read_sf() can use:
const quakesGeoJSON = await fetch("https://earthquake.usgs.gov/earthquakes/feed/v1.0/summary/2.5_day.geojson")
await webR.objs.globalEnv.bind("quakes_json", await quakesGeoJSON.text());There’s nothing special about the R script that is run, so we won’t take up any space for it here. It just does a fairly basic {sf} plot:
Change directory to ch-08/webr-plot, do an npm i -g . and you can start watching where the tremors are!
You can (and should!) take a look at the complete source code and supporting files over at the GitLab repository for this chapter.
Add options to let folks customize the plot, such as:
Check out the filesystem mounting Quarto source document on the WebR GitHub repository, and then poke around for more examples of how WebR deals with packages and directories.
A big reason to use WebR in a CLI context is due to the rich statistics and machine learning ecosystem behind it. We’ll use a serialized model in the next chapter to help folks predict from the terminal.