Recipe 6 Reading and Querying CSV Data With Drill and R
6.1 Problem
You have a CSV file and want to use Drill and R to query it vs read it in to R directly with one of the many “read CSV” functions.
6.2 Solution
Store the CSV file in a directory Drill can access and query it with R.
6.3 Discussion
The Drill manual chapter on “Text Files: CSV, TSV, PSV”12 discusses–at length–how Drill works with this delimited storage format. Future recipes will show how to convert CSV files to a better format (parquet) and, for now, if your CSV file contains a header (as most “normal” CSV files do) there will be one additional step involved before querying it.
For this example, we’ll use World Health Organization (WHO) data on cholera13. A verison of that file is in https://raw.githubusercontent.com/hrbrmstr/drill-sergeant-rstats/master/book-data/who-colera.csv.
You’ll need to store this file https://raw.githubusercontent.com/hrbrmstr/drill-sergeant-rstats/master/book-data/who-cholera.csv in an accessible place by Drill. The default dfs.root storage location is the “top” of your local filesystem hierarchy. It is suggested (for this example) that you put the who-colera.csv into a Data directory underneath your home directory (shorthand filesystem reference for that directory being ~/Data). The full dfs.root for the system used in this example is:
dfs.root.`/Users/bob/Data/who-cholera.csv`Replace bob with your home directory name. (TBD: Windows example path)
However, because this data file has a header, you should (for this example) rename it to use the .csvh extension vs the .csv extension. So, the dfs path should actually be:
dfs.root.`/Users/bob/Data/who-cholera.csvh`The h at the end let’s Drill’s CSV parser know that there are column headers. A future recipe will show you how to make that the default. Note that there are many contexts where CSV files are generated at a regular frequency as part of a well-established process and do not have or require a header line. No header CSVs were used well-before the “big data” term popped up but were heavily used in the early days of “modern” big data processing since header lines in well-established workflows can slow down processing.
You’ve likely noticed this is a small CSV file. Drill can handle large CSV files well, too, as you’ll see in the next recipe.
Now we can work with this data via sergeant. We’ll first take a look at it:
library(sergeant)
library(tidyverse)

db <- src_drill("localhost")

who_cholera <- tbl(db, "dfs.root.`/Users/bob/Data/who-cholera.csvh`")

who_cholera
## # Source: table<dfs.root.`/Users/bob/Data/who-cholera.csvh`> [?? x 3]
## # Database: DrillConnection
## country year reported_cases
## <chr> <chr> <int>
## 1 Afghanistan 2016 677
## 2 Afghanistan 2015 58064
## 3 Afghanistan 2014 45481
## 4 Afghanistan 2013 3957
## 5 Afghanistan 2012 12
## 6 Afghanistan 2011 3733
## 7 Afghanistan 2010 2369
## 8 Afghanistan 2009 662
## 9 Afghanistan 2008 4384
## 10 Afghanistan 2005 33
## # ... with more rowsOne difference between “normal” dplyr and “database” dplyr is that data operations stay at the database until you retrieve them. This is done with collect(). All of the cholera data is still in Drill and the printed display shows 10 observations because the actual query sent to Drill to give you that view is:
SELECT * FROM dfs.root.`/Users/bob/Data/who-cholera.csvh` LIMIT 10This particular CSV file is small enough to collect() and work with locally so you could do:
## # A tibble: 2,470 x 3
##    country     year  reported_cases
##  * <chr>       <chr>          <int>
##  1 Afghanistan 2016             677
##  2 Afghanistan 2015           58064
##  3 Afghanistan 2014           45481
##  4 Afghanistan 2013            3957
##  5 Afghanistan 2012              12
##  6 Afghanistan 2011            3733
##  7 Afghanistan 2010            2369
##  8 Afghanistan 2009             662
##  9 Afghanistan 2008            4384
## 10 Afghanistan 2005              33
## # ... with 2,460 more rows
and have it all in R. Drill also perform aggregation and other operations for you.
You may have noticed that all three columns are <chr> that is due to Drill being schema-less and not really knowing how the CSV file is structured, so it returns the data to R with no hints as to the column data types.
Since we’re working with a datbase, we can “fix” this by being more verbose in how we ask for this CSV data. The second parameter to tbl() does not just have to be a “table” reference. It can be a full SQL query that returns “rectangular” results that can be turned into an R data frame. Drill’s syntax requires such a query to be wrapped in parentheses. We can make the above data a bit more useful with:
tbl(db, "(
SELECT
  country,
  CAST(LTRIM(`year`, ' ') AS int) AS `year`,
  CAST(reported_cases AS int) AS reported_cases
FROM dfs.root.`/Users/bob/Data/who-cholera.csvh`
)") -> who_cholera

who_cholera
## # Source: table<( SELECT country, CAST(LTRIM(`year`, ' ') AS int) AS
## # `year`, CAST(reported_cases AS int) AS reported_cases FROM
## # dfs.root.`/Users/bob/Data/who-cholera.csvh` )> [?? x 3]
## # Database: DrillConnection
## country year reported_cases
## <chr> <int> <int>
## 1 Afghanistan 2016 677
## 2 Afghanistan 2015 58064
## 3 Afghanistan 2014 45481
## 4 Afghanistan 2013 3957
## 5 Afghanistan 2012 12
## 6 Afghanistan 2011 3733
## 7 Afghanistan 2010 2369
## 8 Afghanistan 2009 662
## 9 Afghanistan 2008 4384
## 10 Afghanistan 2005 33
## # ... with more rowsThe CAST() function performs data type conversion and LTRIM() is used to “left trim” characters from strings. The CAST gives a hint about the data type and R now knows it’s an integer. But, why did we need to use LTRIM? You likely didn’t notice the extra ' ' at the beginning of the entriesin the year column:
"country","year","reported_cases"
"Afghanistan"," 2016","677"
"Afghanistan"," 2015","58064"
"Afghanistan"," 2014","45481"
"Afghanistan"," 2013","3957"
"Afghanistan"," 2012","12"
Removing that is necessary before the conversion to integer.
As noted earlier, we can perform wrangling operations in-database vs in-R:
## # Source:     lazy query [?? x 2]
## # Database:   DrillConnection
## # Ordered by: desc(n)
##    country                                n
##    <chr>                              <int>
##  1 India                            1363250
##  2 Haiti                             795794
##  3 Peru                              736195
##  4 Democratic Republic of the Congo  521607
##  5 Indonesia                         394945
##  6 Mozambique                        327913
##  7 Somalia                           311203
##  8 Nigeria                           310217
##  9 Bangladesh                        294647
## 10 Afghanistan                       263843
## # ... with more rows## # Source: lazy query [?? x 2]
## # Database: DrillConnection
## country avg_annual_cases
## <chr> <dbl>
## 1 Afghanistan 11993.
## 2 Albania 626.
## 3 Algeria 636.
## 4 Angola 7348.
## 5 Argentina 758.
## 6 Armenia 25.0
## 7 Australia 3.74
## 8 Austria 1.00
## 9 Azerbaijan 18.0
## 10 Bahamas 1.00
## # ... with more rowslibrary(hrbrthemes)
filter(who_cholera, country == "Yemen") %>%
collect() %>%
mutate(year = as.Date(sprintf("%s-01-01", year))) %>%
ggplot(aes(year, reported_cases)) +
geom_segment(aes(xend=year, yend=0)) +
scale_x_date(date_breaks="3 years", date_labels="'%y") +
scale_y_comma() +
labs(
x = NULL, y = "# reported cases",
title = "Annual Cholera Cases in Yemen (1971-2016)"
) +
theme_ipsum(grid="Y") +
theme(axis.text.y=element_text(vjust=c(0, rep(0.5, 2), 1)))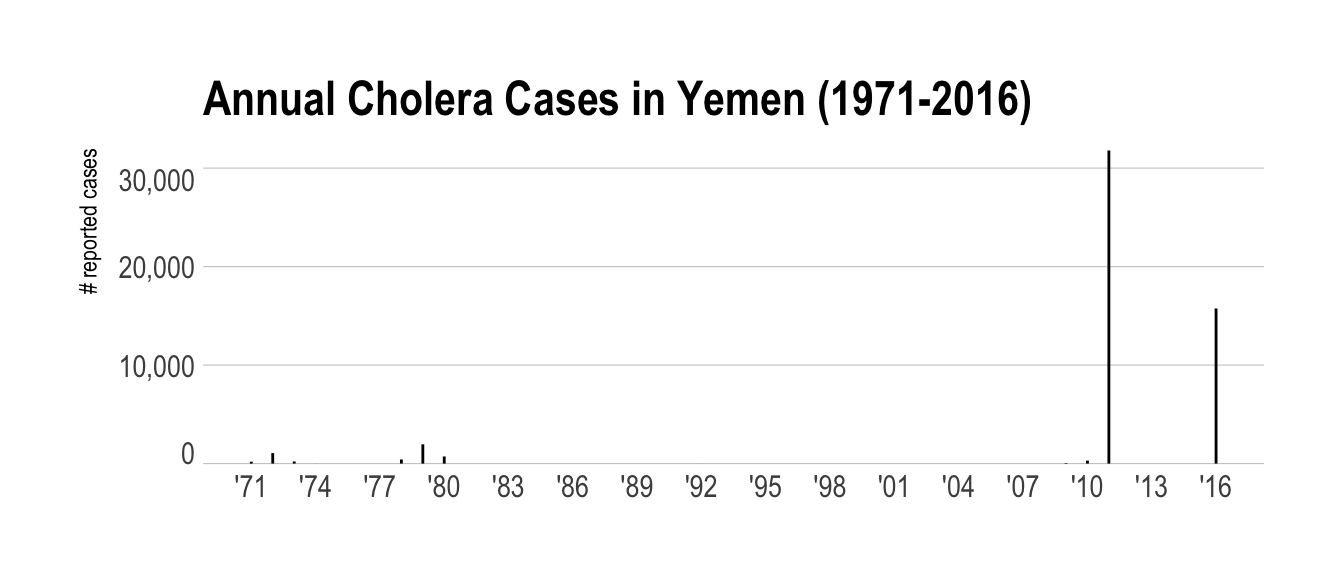
Future recipes will help you debug issues when CASTing data from “malformed” CSV files.